
Page 407 - Fundamentals of Air Pollution 3E
P. 407
V. Wind and Pollution Roses 361
measurement station in New York City for the SO 2 concentration estimates
from the Climatological Dispersion Model (1). The number in the circle is
the total estimated annual SO 2 concentration from the model. The radial
values represent the contribution to the annual concentration from each
direction, with the length of the line proportional to the concentration
resulting from area sources and the length of the rectangle proportional to
the concentration resulting from the point sources. For the monitoring
3
station in Fig. 21-11, the estimated annual concentration is 240 ju,g m~ .
The maximum annual contribution from area sources is from the south
3
(39 ^g irT ); the maximum annual contribution from point sources is from
3
the southwest. (7.1 /ug rrT ). The minimum concentration is from the
east-southeast.
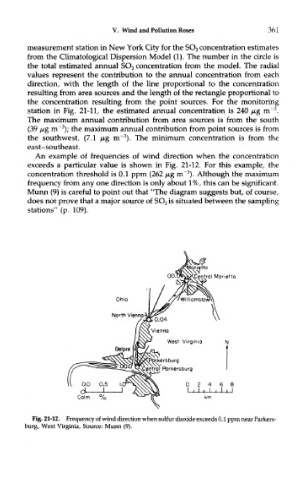
An example of frequencies of wind direction when the concentration
exceeds a particular value is shown in Fig. 21-12. For this example, the
3
concentration threshold is 0.1 ppm (262 /*,g rrT ). Although the maximum
frequency from any one direction is only about 1%, this can be significant.
Munn (9) is careful to point out that "The diagram suggests but, of course,
does not prove that a major source of SO 2 is situated between the sampling
stations" (p. 109).
Fig. 21-12. Frequency of wind direction when sulfur dioxide exceeds 0.1 ppm near Parkers-
burg, West Virginia, Source: Munn (9).