
Page 405 - Fundamentals of Air Pollution 3E
P. 405
V. Wind and Pollution Roses 359
Figure 21-9 is a stability wind rose that indicates Pasquill stability class
frequencies for each direction. For this location, the various stabilities seem
to be nearly a set proportion of the frequency for that direction; the larger
the total frequency for that direction, the greater the frequency for each
stability. Since the frequencies of A and B stabilities are quite small (0.72%
for A and 4.92% for B), all three unstable classes (A, B, and C) are added
together and indicated by the single line.
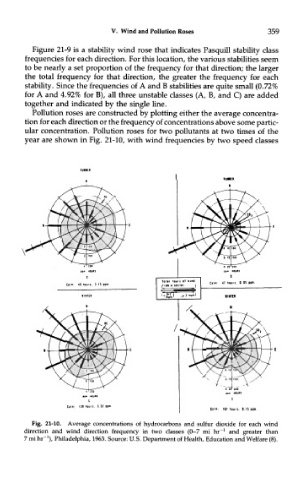
Pollution roses are constructed by plotting either the average concentra-
tion for each direction or the frequency of concentrations above some partic-
ular concentration. Pollution roses for two pollutants at two times of the
year are shown in Fig. 21-10, with wind frequencies by two speed classes
Fig. 21-10. Average concentrations of hydrocarbons and sulfur dioxide for each wind
J
direction and wind direction frequency in two classes (0-7 mi hr~ and greater than
1
7 mi hr- ), Philadelphia, 1963. Source: U.S. Department of Health, Education and Welfare (8)