
Page 400 - Fundamentals of Air Pollution 3E
P. 400
354 21. Air Pollution Climatology
areas of precipitation, and persistence of these conditions for 4 or more
days.
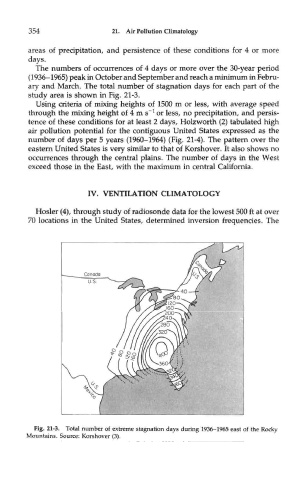
The numbers of occurrences of 4 days or more over the 30-year period
(1936-1965) peak in October and September and reach a minimum in Febru-
ary and March. The total number of stagnation days for each part of the
study area is shown in Fig. 21-3.
Using criteria of mixing heights of 1500 m or less, with average speed
l
through the mixing height of 4 m s~ or less, no precipitation, and persis-
tence of these conditions for at least 2 days, Holzworth (2) tabulated high
air pollution potential for the contiguous United States expressed as the
number of days per 5 years (1960-1964) (Fig. 21-4). The pattern over the
eastern United States is very similar to that of Korshover. It also shows no
occurrences through the central plains. The number of days in the West
exceed those in the East, with the maximum in central California.
IV. VENTILATION CLIMATOLOGY
Hosier (4), through study of radiosonde data for the lowest 500 ft at over
70 locations in the United States, determined inversion frequencies. The
Fig. 21-3. Total number of extreme stagnation days during 1936-1965 east of the Rocky
Mountains. Source: Korshover (3).