
Page 397 - Fundamentals of Air Pollution 3E
P. 397
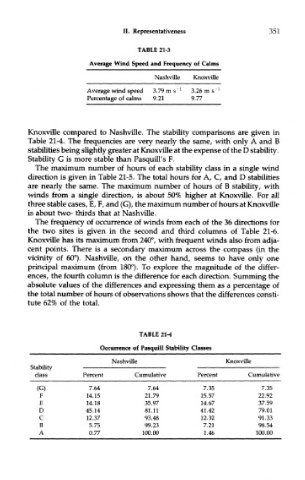
II. Representativeness                 351

                                     TABLE 21-3
                        Average Wind Speed and Frequency of Calms
                                          Nashville  Knoxville
                        Average wind speed  3.79ms"  1  3.26 m s" 1
                        Percentage of calms  9.21   9.77


        Knoxville compared to Nashville. The stability comparisons are given in
        Table 21-4. The frequencies are very nearly the same, with only A and B
        stabilities being slightly greater at Knoxville at the expense of the D stability.
        Stability G is more stable than Pasquill's F.
          The maximum number of hours of each stability class in a single wind
        direction is given in Table 21-5. The total hours for A, C, and D stabilities
        are nearly the same. The maximum number of hours of B stability, with
        winds from a single direction, is about 50% higher at Knoxville. For all
        three stable cases, E, F, and (G), the maximum number of hours at Knoxville
        is about two- thirds that at Nashville.
          The frequency of occurrence of winds from each of the 36 directions for
        the two sites is given in the second and third columns of Table 21-6.
        Knoxville has its maximum from 240°, with frequent winds also from adja-
        cent points. There is a secondary maximum across the compass (in the
        vicinity of 60°). Nashville, on the other hand, seems to have only one
        principal maximum (from 180°). To explore the magnitude of the differ-
        ences, the fourth column is the difference for each direction. Summing the
        absolute values of the differences and expressing them as a percentage of
        the total number of hours of observations shows that the differences consti-
        tute 62% of the total.


                                      TABLE 21-4
                           Occurrence of Pasquill Stability Classes

                              Nashville                      Knoxville
         Stability
          class        Percent      Cumulative       Percent       Cumulative
          (G)           7.64            7.64           7.35           7.35
           F           14.15           21.79          15.57          22.92
           E           14.18           35.97          14.67          37.59
           D           45.14           81.11          41.42          79.01
           C           12.37           93.48          12.32          91.33
           B            5.75           99.23           7.21          98.54
           A            0.77          100.00           1.46          100.00