
Page 402 - Fundamentals of Air Pollution 3E
P. 402
356 21. Air Pollution Climatology
values were used to draw isolines of inversion frequency percentages on
U.S. maps for annual values and the four seasons. The percent of total
hours of inversions for the annual period is shown in Fig. 21-5. Conditions
frequently associated with radiation inversions—light winds and slight
cloud cover at night—were also examined in terms of frequency. Both
display maxima over the desert Southwest.
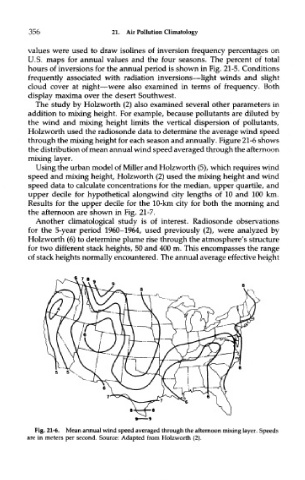
The study by Holzworth (2) also examined several other parameters in
addition to mixing height. For example, because pollutants are diluted by
the wind and mixing height limits the vertical dispersion of pollutants,
Holzworth used the radiosonde data to determine the average wind speed
through the mixing height for each season and annually. Figure 21-6 shows
the distribution of mean annual wind speed averaged through the afternoon
mixing layer.
Using the urban model of Miller and Holzworth (5), which requires wind
speed and mixing height, Holzworth (2) used the mixing height and wind
speed data to calculate concentrations for the median, upper quartile, and
upper decile for hypothetical alongwind city lengths of 10 and 100 km,
Results for the upper decile for the 10-km city for both the morning and
the afternoon are shown in Fig. 21-7.
Another climatological study is of interest. Radiosonde observations
for the 5-year period 1960-1964, used previously (2), were analyzed by
Holzworth (6) to determine plume rise through the atmosphere's structure
for two different stack heights, 50 and 400 m. This encompasses the range
of stack heights normally encountered. The annual average effective height
Fig. 21-6. Mean annual wind speed averaged through the afternoon mixing layer. Speeds
are in meters per second. Source: Adapted from Holzworth (2).