
Page 403 - Fundamentals of Air Pollution 3E
P. 403
V. Wind and Pollution Roses 357
l
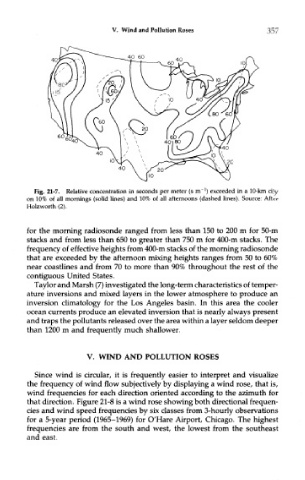
Fig. 21-7. Relative concentration in seconds per meter (s m ) exceeded in a 10-km city
on 10% of all mornings (solid lines) and 10% of all afternoons (dashed lines). Source: After
Holzworth (2).
for the morning radiosonde ranged from less than 150 to 200 m for 50-m
stacks and from less than 650 to greater than 750 m for 400-m stacks. The
frequency of effective heights from 400-m stacks of the morning radiosonde
that are exceeded by the afternoon mixing heights ranges from 50 to 60%
near coastlines and from 70 to more than 90% throughout the rest of the
contiguous United States.
Taylor and Marsh (7) investigated the long-term characteristics of temper-
ature inversions and mixed layers in the lower atmosphere to produce an
inversion climatology for the Los Angeles basin. In this area the cooler
ocean currents produce an elevated inversion that is nearly always present
and traps the pollutants released over the area within a layer seldom deeper
than 1200 m and frequently much shallower.
V. WIND AND POLLUTION ROSES
Since wind is circular, it is frequently easier to interpret and visualize
the frequency of wind flow subjectively by displaying a wind rose, that is,
wind frequencies for each direction oriented according to the azimuth for
that direction. Figure 21-8 is a wind rose showing both directional frequen-
cies and wind speed frequencies by six classes from 3-hourly observations
for a 5-year period (1965-1969) for O'Hare Airport, Chicago. The highest
frequencies are from the south and west, the lowest from the southeast
and east.