
Page 401 - Fundamentals of Air Pollution 3E
P. 401
IV. Ventilation Climatology 355
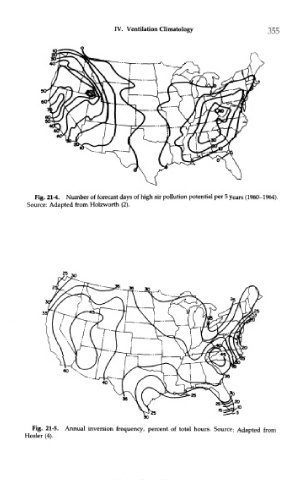
Fig. 21-4. Number of forecast days of high air pollution potential per 5 years (1960-1964).
Source: Adapted from Holzworth (2).
Fig. 21-5. Annual inversion frequency, percent of total hours. Source: Adapted from
Hosier (4).