
Page 398 - Fundamentals of Air Pollution 3E
P. 398
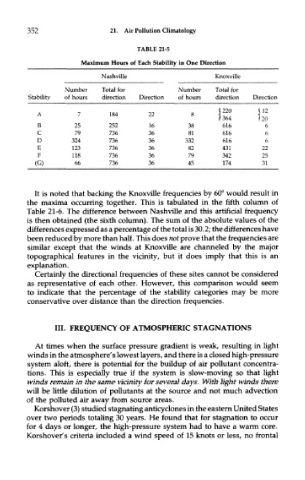
352                    21. Air Pollution Climatology

                                     TABLE 21-5
                      Maximum Hours of Each Stability in One Direction

                           Nashville                      Knoxville
                 Number    Total for            Number    Total for
        Stability  of hours  direction  Direction  of hours  direction  Direction
                                                           (220      112
          A          7       184        22         8
                                                           |364      |20
          B         25       252        16        38        616        6
          C         79       736        36        81        616        6
          D        324       736        36        332       616        6
          E        123       736        36        82       431        22
          F        118       736        36        79       342        2.5
          (G)       66       736        36        45        174       31


         It is noted that backing the Knoxville frequencies by 60° would result in
       the maxima occurring together. This is tabulated in the fifth column of
       Table 21-6. The difference between Nashville and this artificial frequency
       is then obtained (the sixth column). The sum of the absolute values of the
       differences expressed as a percentage of the total is 30.2; the differences have
       been reduced by more than half. This does not prove that the frequencies are
       similar except that the winds at Knoxville are channeled by the major
       topographical features in the vicinity, but it does imply that this is an
       explanation.
         Certainly the directional frequencies of these sites cannot be considered
       as representative of each other. However, this comparison would seem
       to indicate that the percentage of the stability categories may be more
       conservative over distance than the direction frequencies.


               III. FREQUENCY OF ATMOSPHERIC STAGNATIONS

         At times when the surface pressure gradient is weak, resulting in light
       winds in the atmosphere's lowest layers, and there is a closed high-pressure
       system aloft, there is potential for the buildup of air pollutant concentra-
       tions. This is especially true if the system is slow-moving so that light
       winds remain in the same vicinity for several days. With light winds there
       will be little dilution of pollutants at the source and not much advection
       of the polluted air away from source areas.
          Korshover (3) studied stagnating anticyclones in the eastern United States
       over two periods totaling 30 years. He found that for stagnation to occur
       for 4 days or longer, the high-pressure system had to have a warm core.
       Korshover's criteria included a wind speed of 15 knots or less, no frontal