
Page 399 - Fundamentals of Air Pollution 3E
P. 399
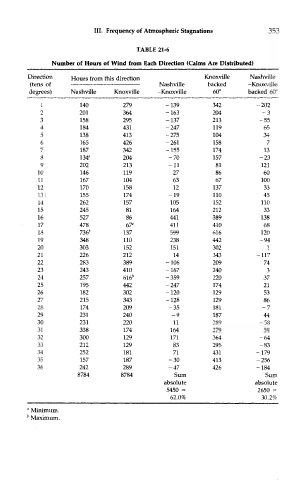
HI. Frequency of Atmospheric Stagnations      353

                                     TABLE 21-6
               Number of Hours of Wind from Each Direction (Calms Are Distributed)
        Direction   Hours from this direction          Knoxville   Nashville
         (tens of                          Nashville    backed     -Knoxville
        degrees)    Nashville  Knoxville   -Knoxville     60°      backed 60°
            1         140         279        -139         342        -202
           2          201         364        -163         204           o
            3         158         295        -137         213         -55
           4          184         431        -247         119          65
            5         138         413        -275         104          34
            6         165         426        -261         158           7
            7         187         342        -155         174          13
            8         134"        204         -70         157         -23
            9         202         213         -11         81          121
           10         146         119          27         86           60
           11         167         104          63         67          100
           12         170         158          12         137          33
           13         155         174         -19         110          45
           14         262         157         105         152         110
           15         245         81          164         212          33
           16         527         86          441         389         138
           17         478         67°         411        410           68
           18         736 fc      137         599         616         120
           19         348         110         238         442         -94
           20         303         152         151         302           1
           21         226         212          14         343        -117
           22         283         389        -106         209          74
           23         243         410        -167         240           3
           24         257         6l6 b      -359         220          37
           25         195         442        -247         174          21
           26         182         302        -120         129          53
           27         215         343        -128         129          86
           28         174         209         -35         181           7
           29         231         240          -9         187          44
           30         231         220          11         289         -58
           31         338         174         164         279          59
           32         300         129         171         364         -64
           33         212         129          83        295          -83
           34         252         181          71         431        -179
           35         157         187         -30        413         -256
           36         242         289         -47        426         -184
                     8784        8784          Sum                      Sum
                                             absolute                absolute
                                             OriOU ~                  2650 =
                                              62.0%                    30.2%
        " Minimum.
        * Maximum.