
Page 394 - Fundamentals of Air Pollution 3E
P. 394
348 21. Air Pollution Climatology
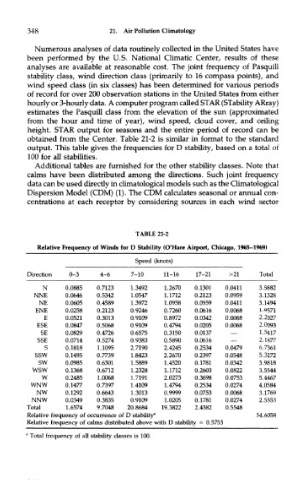
Numerous analyses of data routinely collected in the United States have
been performed by the U.S. National Climatic Center, results of these
analyses are available at reasonable cost. The joint frequency of Pasquill
stability class, wind direction class (primarily to 16 compass points), and
wind speed class (in six classes) has been determined for various periods
of record for over 200 observation stations in the United States from either
hourly or 3-hourly data. A computer program called STAR (STability ARray)
estimates the Pasquill class from the elevation of the sun (approximated
from the hour and time of year), wind speed, cloud cover, and ceiling
height. STAR output for seasons and the entire period of record can be
obtained from the Center. Table 21-2 is similar in format to the standard
output. This table gives the frequencies for D stability, based on a total of
100 for all stabilities.
Additional tables are furnished for the other stability classes. Note that
calms have been distributed among the directions. Such joint frequency
data can be used directly in climatological models such as the Climatological
Dispersion Model (COM) (1). The CDM calculates seasonal or annual con-
centrations at each receptor by considering sources in each wind sector
TABLE 21-2
Relative Frequency of Winds for D Stability (O'Hare Airport, Chicago, 1965-1969)
Speed (knots)
Direction 0-3 4-6 7-10 11-16 17-21 >21 Total
N 0.0885 0.7123 1.3492 1.2670 0.1301 0.0411 3.5882
NNE 0.0646 0.5342 1.0547 1.1712 0.2123 0.0959 3.1328
NE 0.0605 0.4589 1.3972 1.0958 0.0959 0.0411 3.1494
ENE 0.0258 0.2123 0.9246 0.7260 0.0616 0.0068 1.9571
E 0.0521 0.3013 0.9109 0.8972 0.0342 0.0068 2.2027
ESE 0.0847 0.5068 0.9109 0.4794 0.0205 0.0068 2.0093
SE 0.0829 0.4726 0.6575 0.3150 0.0137 — 1.5417
SSE 0.0714 0.5274 0.9383 0.5890 0.0616 — 2.1877
S 0.1818 1.1095 2.7190 2.4245 0.2534 0.0479 6.7361
ssw 0.1495 0.7739 1.8423 2.2670 0.2397 0.0548 5.3272
sw 0.0985 0.6301 1.5889 1.4520 0.1781 0.0342 3.9818
wsw 0.1368 0.6712 1.2328 1.1712 0.2603 0.0822 3.5544
w 0.2485 1.0068 1.7191 2.0273 0.3698 0.0753 5.4467
WNW 0.1477 0.7397 1.4109 1.4794 0.2534 0.0274 4.0584
NW 0.1292 0.6643 1.3013 0.9999 0.0753 0.0068 3.1769
NNW 0.0349 0.3835 0.9109 1.0205 0.1781 0.0274 2.5553
Total 1.6574 9.7048 20.8684 19.3822 2.4382 0.5548
Relative frequency of occurrence of D stability" 54.6058
Relative frequency of calms distributed above with D stability = 0.5753
" Total frequency of all stability classes is 100.