
Page 256 - Fundamentals of Air Pollution
P. 256
I. Stationary Monitoring Networks 21.7
is established at least 12 months before construction to determine prior air
quality. Once the facility is completed and in operation, the network data
determine the actual impact of the new source.
Long-term trends are measured by stationary air quality monitoring net-
works. Figure 4-4 shows the long-term decrease of SO 2 in the atmosphere
resulting from the implementation of air pollution control technology. The
trends in other atmospheric trace gases such as methane, NO, NO 2, and
CO are similarly measured in rural as well as urban locations. Atmospheric
budgets of various gases are developed to allow estimation of whether
sources are anthropogenic or natural.
A stationary monitoring network should yield the following information:
(1) background concentration levels, (2) highest concentration levels,
(3) representative concentration levels in high-density areas, (4) the impact
of local sources, (5) the impact of remote sources, and (6) the relative impact
of natural and anthropogenic sources.
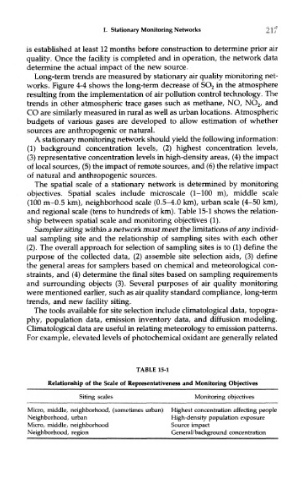
The spatial scale of a stationary network is determined by monitoring
objectives. Spatial scales include microscale (1-100 m), middle scale
(100 m-0.5 km), neighborhood scale (0.5-4.0 km), urban scale (4-50 km),
and regional scale (tens to hundreds of km). Table 15-1 shows the relation-
ship between spatial scale and monitoring objectives (1).
Sampler siting within a network must meet the limitations of any individ-
ual sampling site and the relationship of sampling sites with each other
(2). The overall approach for selection of sampling sites is to (1) define the
purpose of the collected data, (2) assemble site selection aids, (3) define
the general areas for samplers based on chemical and meteorological con-
straints, and (4) determine the final sites based on sampling requirements
and surrounding objects (3). Several purposes of air quality monitoring
were mentioned earlier, such as air quality standard compliance, long-term
trends, and new facility siting.
The tools available for site selection include climatological data, topogra-
phy, population data, emission inventory data, and diffusion modeling.
Climatological data are useful in relating meteorology to emission patterns.
For example, elevated levels of photochemical oxidant are generally related
TABLE 15-1
Relationship of the Scale of Representativeness and Monitoring Objectives
Siting scales Monitoring objectives
Micro, middle, neighborhood, (sometimes urban) Highest concentration affecting people
Neighborhood, urban High-density population exposure
Micro, middle, neighborhood Source impact
Neighborhood, region General/background concentration