
Page 261 - Fundamentals of Air Pollution
P. 261
222 15. Air Pollution Monitoring and Surveillance
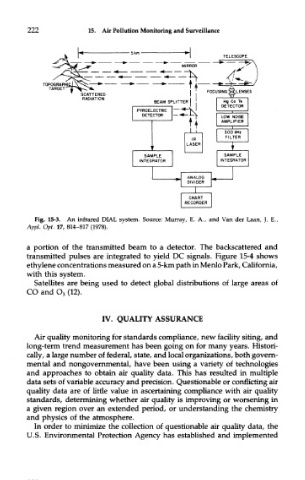
Fig. 15-3. An infrared DIAL system. Source: Murray, E. A., and Van der Laan, J. E.,
Appl. Opt. 17, 814-817 (1978).
a portion of the transmitted beam to a detector. The backscattered and
transmitted pulses are integrated to yield DC signals. Figure 15-4 shows
ethylene concentrations measured on a 5-km path in Menlo Park, California,
with this system.
Satellites are being used to detect global distributions of large areas of
CO and O 3 (12).
IV. QUALITY ASSURANCE
Air quality monitoring for standards compliance, new facility siting, and
long-term trend measurement has been going on for many years. Histori-
cally, a large number of federal, state, and local organizations, both govern-
mental and nongovernmental, have been using a variety of technologies
and approaches to obtain air quality data. This has resulted in multiple
data sets of variable accuracy and precision. Questionable or conflicting air
quality data are of little value in ascertaining compliance with air quality
standards, determining whether air quality is improving or worsening in
a given region over an extended period, or understanding the chemistry
and physics of the atmosphere.
In order to minimize the collection of questionable air quality data, the
U.S. Environmental Protection Agency has established and implemented