
Page 264 - Fundamentals of Air Pollution
P. 264
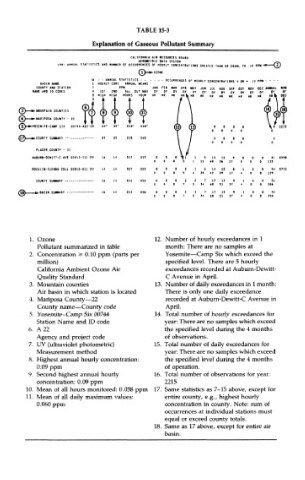
TABLE 15-3
                         Explanation of Gaseous Pollutant Summary


        1. Ozone                         12. Number of hourly exceedances in 1
          Pollutant summarized in table     month: There are no samples at
        2. Concentration 2= 0.10 ppm (parts per  Yosemite—Camp Six which exceed the
          million)                          specified level. There are 5 hourly
          California Ambient Ozone Air      exceedances recorded at Auburn-Dewitt-
          Quality Standard                  C Avenue in April.
        3. Mountain counties              13. Number of daily exceedances in 1 month:
          Air basin in which station is located  There is only one daily exceedance
        4. Mariposa County—22               recorded at Auburn-Dewitt-C Avenue in
          County name—County code           April.
        5. Yosemite-Camp Six 00744        14. Total number of hourly exceedances for
          Station Name and ID code          year: There are no samples which exceed
        6. A 22                             the specified level during the 4 months
          Agency and project code           of observations,
        7. UV (ultraviolet photometric)   15. Total number of daily exceedances for
          Measurement method                year: There are no samples which exceed
        8. Highest annual hourly concentration:  the specified level during the 4 months
          0.09 ppm                          of operation.
        9. Second highest annual hourly   16. Total number of observations for year:
          concentration: 0.09 ppm           2215
       10. Mean of all hours monitored: 0.038 ppm  17. Same statistics as 7-15 above, except for
       11. Mean of all daily maximum values:  entire county, e.g., highest hourly
          0.060 ppm                         concentration in county. Note: sum of
                                            occurrences at individual stations must
                                            equal or exceed county totals.
                                          18. Same as 17 above, except for entire air
                                            basin.