
Page 153 - Fundamentals of Communications Systems
P. 153
Complex Baseband Representation of Bandpass Signals 4.29
˜ x t()
x t() c H () y t()
f
c T c
(
2 cos 2πf t)
2
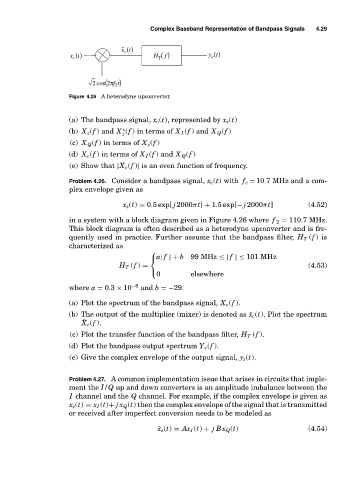
Figure 4.26 A heterodyne upconverter.
(a) The bandpass signal, x c (t), represented by x z (t)
(b) X z (f ) and X (f ) in terms of X I (f ) and X Q (f )
∗
z
(c) X Q (f ) in terms of X z (f )
(d) X c (f ) in terms of X I (f ) and X Q (f )
(e) Show that |X c (f )| is an even function of frequency.
Problem 4.26. Consider a bandpass signal, x c (t) with f c = 10.7 MHz and a com-
plex envelope given as
x z (t) = 0.5 exp[ j 2000πt] + 1.5 exp[− j 2000πt] (4.52)
in a system with a block diagram given in Figure 4.26 where f 2 = 110.7 MHz.
This block diagram is often described as a heterodyne upconverter and is fre-
quently used in practice. Further assume that the bandpass filter, H T (f )is
characterized as
⎧
⎨a| f |+ b 99 MHz ≤| f |≤ 101 MHz
H T (f ) = (4.53)
0 elsewhere
⎩
where a = 0.3 × 10 −6 and b =−29.
(a) Plot the spectrum of the bandpass signal, X c (f ).
(b) The output of the multiplier (mixer) is denoted as ˜x c (t). Plot the spectrum
˜
X c (f ).
(c) Plot the transfer function of the bandpass filter, H T (f ).
(d) Plot the bandpass output spectrum Y c (f ).
(e) Give the complex envelope of the output signal, y z (t).
Problem 4.27. A common implementation issue that arises in circuits that imple-
ment the I/Q up and down converters is an amplitude imbalance between the
I channel and the Q channel. For example, if the complex envelope is given as
x z (t) = x I (t)+ jx Q (t) then the complex envelope of the signal that is transmitted
or received after imperfect conversion needs to be modeled as
˜ x z (t) = Ax I (t) + jBx Q (t) (4.54)