
Page 151 - Fundamentals of Communications Systems
P. 151
Complex Baseband Representation of Bandpass Signals 4.27
x t()
A
1
T 2T 3T 4T t
x t()
P
π/2
T 2T 3T 4T t
−π/2
−π
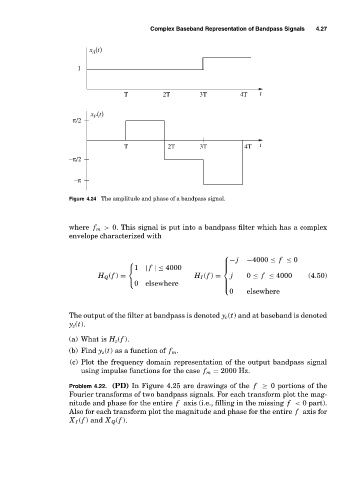
Figure 4.24 The amplitude and phase of a bandpass signal.
where f m > 0. This signal is put into a bandpass filter which has a complex
envelope characterized with
⎪ − j −4000 ≤ f ≤ 0
⎧
⎧ ⎪
⎨1 | f |≤ 4000 ⎪
⎨
H Q (f ) = H I (f ) = j 0 ≤ f ≤ 4000 (4.50)
0 elsewhere ⎪
⎩ ⎪
⎪
0 elsewhere
⎩
The output of the filter at bandpass is denoted y c (t) and at baseband is denoted
y z (t).
(a) What is H z (f ).
(b) Find y z (t) as a function of f m .
(c) Plot the frequency domain representation of the output bandpass signal
using impulse functions for the case f m = 2000 Hz.
Problem 4.22. (PD) In Figure 4.25 are drawings of the f ≥ 0 portions of the
Fourier transforms of two bandpass signals. For each transform plot the mag-
nitude and phase for the entire f axis (i.e., filling in the missing f < 0 part).
Also for each transform plot the magnitude and phase for the entire f axis for
X I (f ) and X Q (f ).