
Page 207 - Fundamentals of Enhanced Oil and Gas Recovery
P. 207
Chemical Flooding 195
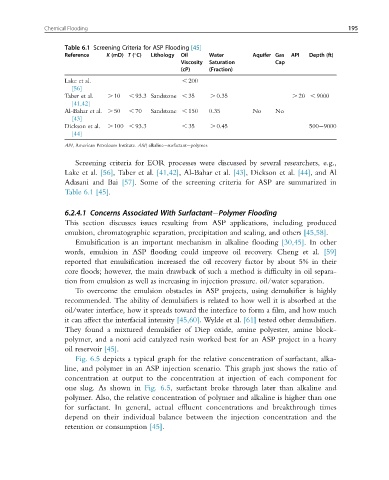
Table 6.1 Screening Criteria for ASP Flooding [45]
Reference K (mD) T ( C) Lithology Oil Water Aquifer Gas API Depth (ft)
Viscosity Saturation Cap
(cP) (Fraction)
Lake et al. , 200
[56]
Taber et al. . 10 , 93.3 Sandstone , 35 . 0.35 . 20 , 9000
[41,42]
Al-Bahar et al. . 50 , 70 Sandstone , 150 0.35 No No
[43]
Dickson et al. . 100 , 93.3 , 35 . 0.45 500 9000
[44]
API, American Petroleum Institute. ASP, alkaline surfactant polymer.
Screening criteria for EOR processes were discussed by several researchers, e.g.,
Lake et al. [56], Taber et al. [41,42], Al-Bahar et al. [43], Dickson et al. [44], and Al
Adasani and Bai [57]. Some of the screening criteria for ASP are summarized in
Table 6.1 [45].
6.2.4.1 Concerns Associated With Surfactant Polymer Flooding
This section discusses issues resulting from ASP applications, including produced
emulsion, chromatographic separation, precipitation and scaling, and others [45,58].
Emulsification is an important mechanism in alkaline flooding [30,45]. In other
words, emulsion in ASP flooding could improve oil recovery. Cheng et al. [59]
reported that emulsification increased the oil recovery factor by about 5% in their
core floods; however, the main drawback of such a method is difficulty in oil separa-
tion from emulsion as well as increasing in injection pressure. oil/water separation.
To overcome the emulsion obstacles in ASP projects, using demulsifier is highly
recommended. The ability of demulsifiers is related to how well it is absorbed at the
oil/water interface, how it spreads toward the interface to form a film, and how much
it can affect the interfacial intensity [45,60]. Wylde et al. [61] tested other demulsifiers.
They found a mixtured demulsifier of Diep oxide, amine polyester, amine block-
polymer, and a noni acid catalyzed resin worked best for an ASP project in a heavy
oil reservoir [45].
Fig. 6.5 depicts a typical graph for the relative concentration of surfactant, alka-
line, and polymer in an ASP injection scenario. This graph just shows the ratio of
concentration at output to the concentration at injection of each component for
one slug. As shown in Fig. 6.5, surfactant broke through later than alkaline and
polymer. Also, the relative concentration of polymer and alkaline is higher than one
for surfactant. In general, actual effluent concentrations and breakthrough times
depend on their individual balance between the injection concentration and the
retention or consumption [45].