
Page 78 - Fundamentals of Enhanced Oil and Gas Recovery
P. 78
66 Ramin Moghadasi et al.
C 1
S S = Injected solvent composition
O = Reservoir oil composition
V
1
V
2
M
Tie lines 1 M
2 V 3
V
4
C = Critical point
L
1
L
2 L L
3 4
C 7+ C –C 6
2
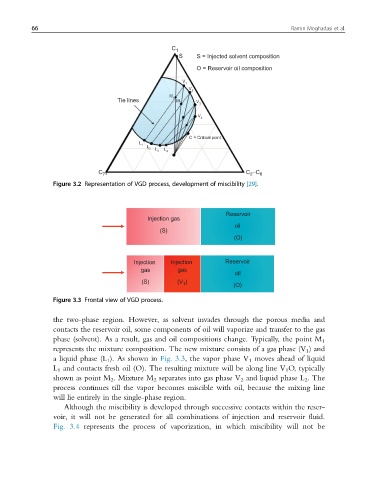
Figure 3.2 Representation of VGD process, development of miscibility [29].
Reservoir
Injection gas
oil
(S)
(O)
Injection Injection Reservoir
gas gas
oil
(S) (V ) (O)
1
Figure 3.3 Frontal view of VGD process.
the two-phase region. However, as solvent invades through the porous media and
contacts the reservoir oil, some components of oil will vaporize and transfer to the gas
phase (solvent). As a result, gas and oil compositions change. Typically, the point M 1
represents the mixture composition. The new mixture consists of a gas phase (V 1 ) and
a liquid phase (L 1 ). As shown in Fig. 3.3, the vapor phase V 1 moves ahead of liquid
L 1 and contacts fresh oil (O). The resulting mixture will be along line V 1 O, typically
shown as point M 2 . Mixture M 2 separates into gas phase V 2 and liquid phase L 2 . The
process continues till the vapor becomes miscible with oil, because the mixing line
will lie entirely in the single-phase region.
Although the miscibility is developed through successive contacts within the reser-
voir, it will not be generated for all combinations of injection and reservoir fluid.
Fig. 3.4 represents the process of vaporization, in which miscibility will not be