
Page 79 - Fundamentals of Enhanced Oil and Gas Recovery
P. 79
67
Enhanced Oil Recovery Using CO 2
C 1 S = Injected solvent composition
O = Reservoir oil composition
S
V 1
V V
2 3
V
Tie lines 4
M
1
M
4
M
L M 3 Critical point
1 2
L 2
O
L L
3 4
Critical tie line
C 7+ C –C 6
2
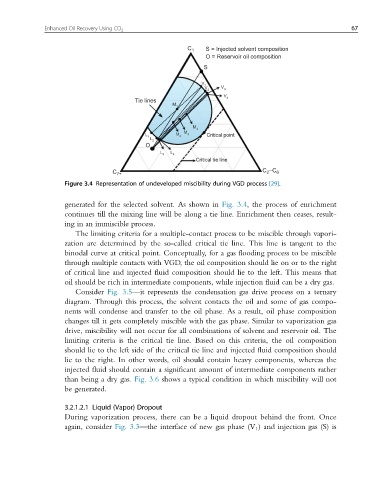
Figure 3.4 Representation of undeveloped miscibility during VGD process [29].
generated for the selected solvent. As shown in Fig. 3.4, the process of enrichment
continues till the mixing line will be along a tie line. Enrichment then ceases, result-
ing in an immiscible process.
The limiting criteria for a multiple-contact process to be miscible through vapori-
zation are determined by the so-called critical tie line. This line is tangent to the
binodal curve at critical point. Conceptually, for a gas flooding process to be miscible
through multiple contacts with VGD, the oil composition should lie on or to the right
of critical line and injected fluid composition should lie to the left. This means that
oil should be rich in intermediate components, while injection fluid can be a dry gas.
Consider Fig. 3.5—it represents the condensation gas drive process on a ternary
diagram. Through this process, the solvent contacts the oil and some of gas compo-
nents will condense and transfer to the oil phase. As a result, oil phase composition
changes till it gets completely miscible with the gas phase. Similar to vaporization gas
drive, miscibility will not occur for all combinations of solvent and reservoir oil. The
limiting criteria is the critical tie line. Based on this criteria, the oil composition
should lie to the left side of the critical tie line and injected fluid composition should
lie to the right. In other words, oil should contain heavy components, whereas the
injected fluid should contain a significant amount of intermediate components rather
than being a dry gas. Fig. 3.6 shows a typical condition in which miscibility will not
be generated.
3.2.1.2.1 Liquid (Vapor) Dropout
During vaporization process, there can be a liquid dropout behind the front. Once
again, consider Fig. 3.3—the interface of new gas phase (V 1 ) and injection gas (S) is