
Page 80 - Fundamentals of Enhanced Oil and Gas Recovery
P. 80
68 Ramin Moghadasi et al.
C 1
S = Injected solvent composition
O = Reservoir oil composition
Tie lines
V
1
V
2
V S
3
Limiting tie line coincides
M V with critical tie line
M 2 4
1
M
4
O L 1 Critical point
L L 3
2
M 3
L 4
C 7+ C –C 6
2
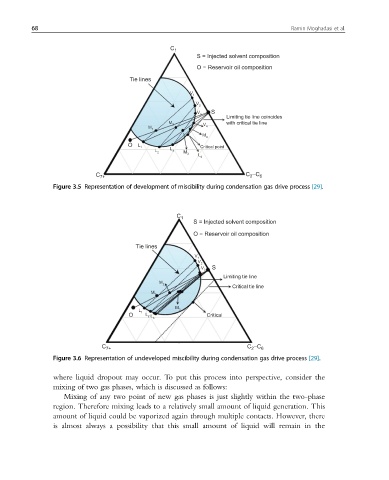
Figure 3.5 Representation of development of miscibility during condensation gas drive process [29].
C 1
S = Injected solvent composition
O = Reservoir oil composition
Tie lines
V
1
V
2
V S
3
Limiting tie line
M 2
Critical tie line
M
1
M
L 3
O 1 L 2 L Critical
3
C 7+ C 2 –C 6
Figure 3.6 Representation of undeveloped miscibility during condensation gas drive process [29].
where liquid dropout may occur. To put this process into perspective, consider the
mixing of two gas phases, which is discussed as follows:
Mixing of any two point of new gas phases is just slightly within the two-phase
region. Therefore mixing leads to a relatively small amount of liquid generation. This
amount of liquid could be vaporized again through multiple contacts. However, there
is almost always a possibility that this small amount of liquid will remain in the