Page 91 - Fundamentals of Enhanced Oil and Gas Recovery
P. 91

79
             Enhanced Oil Recovery Using CO 2

                   parameter that could assist flow modeling/prediction as it is involved in a dimension-
                   less parameter called mobility ratio. Mobility relates fluid flow resistance to rock prop-
                   erty of a porous medium [12]. Mobility ratio is defined as the mobility of displacing
                   fluid (gas) divided by the mobility of displaced fluid (crude oil). Eq. (3.15) presents a
                   two-phase mobility ratio as follows:

                                                        k rg k ro
                                                   M 5     =                             (3.15)
                                                        μ   μ
                                                         g   o
                   where k rg , k ro μ g , and μ o stand for gas relative permeability, oil relative permeability,
                   gas and oil viscosity, respectively.
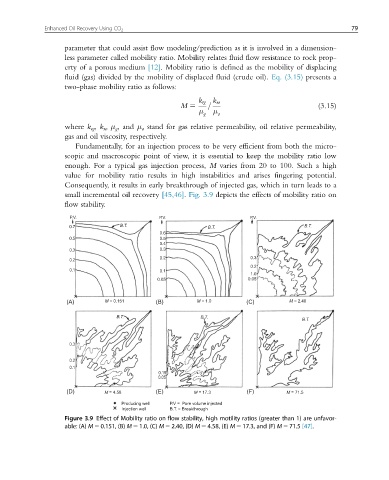
                      Fundamentally, for an injection process to be very efficient from both the micro-
                   scopic and macroscopic point of view, it is essential to keep the mobility ratio low
                   enough. For a typical gas injection process, M varies from 20 to 100. Such a high
                   value for mobility ratio results in high instabilities and arises fingering potential.
                   Consequently, it results in early breakthrough of injected gas, which in turn leads to a
                   small incremental oil recovery [45,46]. Fig. 3.9 depicts the effects of mobility ratio on
                   flow stability.
                    P.V.                     P.V.                     P.V.
                                  B.T.                                               B.T.
                    0.7                                    B.T.
                                             0.6
                    0.5                      0.5
                                             0.4
                    0.3                      0.3
                                             0.2                      0.3
                    0.2
                                                                      0.2
                    0.1                      0.1
                                                                      1.0
                                             0.05                     0.05
                   (A)        M = 0.151     (B)         M = 1.0      (C)         M = 2.40
                                 B.T.                    B.T.
                                                                                     B.T.


                    0.3

                    0.2
                    0.1
                                             0.15
                                             0.05
                   (D)        M = 4.58      (E)        M = 17.3      (F)        M = 71.5

                                   Producing well  P.V =  Pore volume injected
                                   Injection well  B.T. = Breakthrough
                   Figure 3.9 Effect of Mobility ratio on flow stability, high motility ratios (greater than 1) are unfavor-
                   able: (A) M 5 0.151, (B) M 5 1.0, (C) M 5 2.40, (D) M 5 4.58, (E) M 5 17.3, and (F) M 5 71.5 [47].
   86   87   88   89   90   91   92   93   94   95   96