
Page 94 - Fundamentals of Enhanced Oil and Gas Recovery
P. 94
82 Ramin Moghadasi et al.
400
100 Natural gas
100°F
Viscosity (cP) 40 CO 2
10 Methane
80°F
4 CO 2
0 400 800
Saturation pressure (psia)
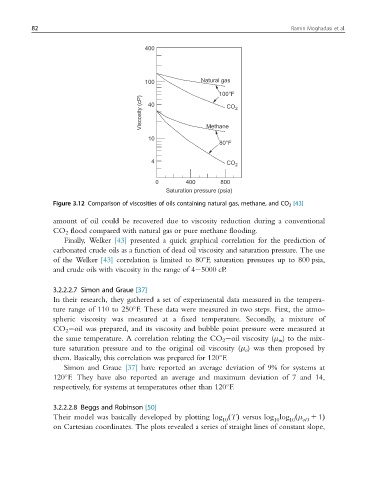
Figure 3.12 Comparison of viscosities of oils containing natural gas, methane, and CO 2 [43]
amount of oil could be recovered due to viscosity reduction during a conventional
CO 2 flood compared with natural gas or pure methane flooding.
Finally, Welker [43] presented a quick graphical correlation for the prediction of
carbonated crude oils as a function of dead oil viscosity and saturation pressure. The use
of the Welker [43] correlation is limited to 80 F, saturation pressures up to 800 psia,
and crude oils with viscosity in the range of 4 5000 cP.
3.2.2.2.7 Simon and Graue [37]
In their research, they gathered a set of experimental data measured in the tempera-
ture range of 110 to 250 F. These data were measured in two steps. First, the atmo-
spheric viscosity was measured at a fixed temperature. Secondly, a mixture of
CO 2 oil was prepared, and its viscosity and bubble point pressure were measured at
the same temperature. A correlation relating the CO 2 oil viscosity (μ m ) to the mix-
ture saturation pressure and to the original oil viscosity (μ o ) was then proposed by
them. Basically, this correlation was prepared for 120 F.
Simon and Graue [37] have reported an average deviation of 9% for systems at
120 F. They have also reported an average and maximum deviation of 7 and 14,
respectively, for systems at temperatures other than 120 F.
3.2.2.2.8 Beggs and Robinson [50]
Their model was basically developed by plotting log ðÞ versus log log ðμ 1 1Þ
T
10 10 10 oD
on Cartesian coordinates. The plots revealed a series of straight lines of constant slope,