
Page 143 - Fundamentals of Gas Shale Reservoirs
P. 143
PETROPHYSICAL MEASUREMENTS OF GAS SHALE RESERVOIRS 123
6.3.3 Permeability Measurement drops due to the dead space in the sample cell. After that, it
decays with time to a lower pressure as helium moves into
Permeability is one of the most difficult properties to mea the matrix pores of the crushed samples (Luffel, 1993). This
sure in gas shale reservoirs. There are several methods for observed pressure decay can be used to determine gas per
permeability measurement/estimation for shale formations:
meability. The permeability values for both methods (pulse
decay and pressure decay) can be determined using a simu
1. Unsteady‐state techniques: Pulse decay (performed on lation‐based history matching or analytical solution (Cui
the plug sample) and pressure decay (performed on et al., 2009; Darabi et al., 2012; Jones, 1997).
the crushed sample) Permeability can be determined through the desorption
2. Permeability determination from desorption test test from fresh cores retrieved from the wells. The cores are
3. Use of mercury injection capillary pressure (MICP) data put into specially designed canisters at reservoir temperature
4. Use of nuclear magnetic resonance (NMR) data to desorb gas at ambient pressure. The cumulative volume of
released gas is measured with time. Primarily, these data can
Routine methods for measuring permeability in the laboratory be used to evaluate the gas content of the gas shale; however,
are based on steady‐state flow. However, if the permeability the gas desorption rate from freshly cut cores can also be
is low, it needs a long period of time for establishing steady‐ related to matrix permeability and diffusivity of the shale
state flow; therefore, unsteady state flow is preferred for gas samples (Cui et al., 2009).
shale. A pulse decay method to measure low permeability Permeability can also be estimated from MICP data. As
has been introduced by Brace et al. (1968). This methodology was mentioned earlier, mercury intrusion measures the pore
uses a cylindrical sample under hydrostatic confining throats. Pore throats provide the path of fluid flow to the
pressure, which is connected to two fluid reservoirs. At the pore body; therefore, it could give an idea about permeability
start of the experiment, the fluid pressure in the upstream as well. The most common methodology for permeability
reservoir is suddenly increased. When fluid flows from the estimation through mercury injection data is the Swanson
upstream reservoir, its pressure in that reservoir declines (1981) method. According to this method, permeability is a
with time. Similarly, when fluid flows from the sample into function of capillary pressure and mercury saturation at the
the downstream reservoir, its pressure builds up with time apex of a hyperbolic log–log mercury injection plot. It is
(Jones, 1997). The sample permeability can be calculated worth mentioning that the Swanson method and all other
from the observed pressure decay in the upstream or the methodologies for permeability estimation through using
pressure buildup in the downstream reservoir. mercury injection are intended for sandstone (Pittman,
Another approach to measure matrix permeability is 1992), tight gas sands (Rezaee et al., 2012), and carbonates
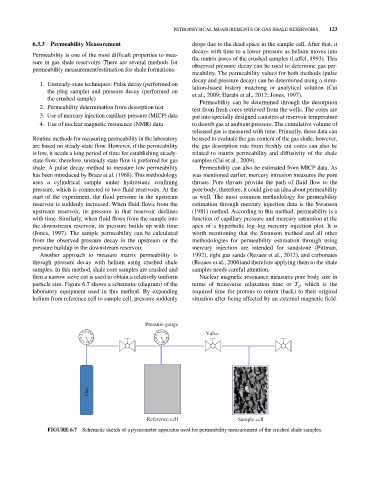
through pressure decay with helium using crushed shale (Rezaee et al., 2006)and therefore applying them to the shale
samples. In this method, shale core samples are crushed and samples needs careful attention.
then a narrow sieve cut is used to obtain a relatively uniform Nuclear magnetic resonance measures pore body size in
particle size. Figure 6.7 shows a schematic (diagram) of the terms of transverse relaxation time or T , which is the
2
laboratory equipment used in this method. By expanding required time for protons to return (back) to their original
helium from reference cell to sample cell, pressure suddenly situation after being affected by an external magnetic field.
Pressure gauge
40 50 60 40 50 60 Valve
30 70 30 70
20 80 20 80
10 90 10 90
0 100 0 100
Gas
Reference cell Sample cell
FIGURE 6.7 Schematic sketch of a pycnometer apparatus used for permeability measurement of the crushed shale samples.