
Page 139 - Fundamentals of Gas Shale Reservoirs
P. 139
KEY PROPERTIES FOR GAS SHALE EVALUATION 119
6.2.4 Gas Storage Capacity potential sites for methane adsorption; therefore, considering
Figure 6.1, micropores and mesopores are the better sites for
Gas in place is often the critical factor for evaluating the eco methane adsorption, while macropores are conducive to free
nomics of a gas shale system. The gas storage mechanism in gas storage because of the low effect on surface area and the
the shale layers is different from conventional reservoirs. In larger pore volume.
shales, natural gas can be stored in two main ways: free gas The presence of organic matter in shales lowers density,
in pores and fractures and condensed gas in a form of increases micro/mesoporosity, provides the source of gas,
adsorbed gas on the surface of organic material and clay alters the wettability, and facilitates adsorption (Zhang et al.,
minerals. 2012). A generally positive correlation of methane sorption
It is believed that much of the gas is stored in the adsorbed
state for gas shale. For example, some studies suggest that capacity with TOC in shales has been observed in previous
studies (Lu et al., 1995; Ross and Bustin, 2009). Zhang et al.
50% of the total gas storage in the Devonian shale exists as a (2012) showed that gas sorption capacities of kerogen decrease
condensed adsorbed phase (Lu et al., 1995). The relative in the following order: type III > type II > type I (Fig. 6.3a).
importance of each mode of gas storage is determined by They attributed the differences in gas sorption capacities
pore space characteristics, organic matter characteristics, among different kerogen types to changes in chemical struc
mineralogical composition, and geological conditions (Allen tures, and stated that aromatic‐rich kerogens have a stronger
et al., 2009; Ross, 2007). affinity with methane than kerogens containing more aliphatic
Size and surface area of the pores have an effect on the
mode of gas storage. Higher surface area means higher organic matter. They also showed that the shale samples with
higher thermal maturity have a higher capacity for methane
adsorption. As can be seen in Figure 6.3b, the Barnett shale
samples with maturity of 0.58 and 0.81% R have similar gas
o
sorption capacities, whereas a sample with 2.1% R has an
o
obviously higher adsorbed gas capacity.
Mineralogical composition can greatly affect the adsorbed
gas capacity. Based on a study by Ross and Bustin (2009),
Pore space clay minerals, especially illite and montmorillonite, have a
large adsorbed gas capacity due to the presence of greater
micropore volume and surface area.
Finally, geological conditions like depth, reservoir tem
Matrix perature, reservoir pressure, and moisture content could
have an effect on the amount of adsorbed, free, and dissolved
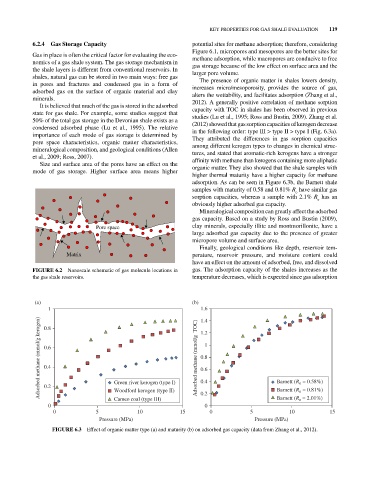
FIGURE 6.2 Nanoscale schematic of gas molecule locations in gas. The adsorption capacity of the shales increases as the
the gas shale reservoirs. temperature decreases, which is expected since gas adsorption
(a) (b)
1 1.6
Adsorbed methane (mmol/g kerogen) 0.6 Adsorbed methane (mmol/g TOC) 0.8 1 Barnett (R = 0.58%)
1.4
0.8
1.2
0.4
0.6
0.4
o
0.2
Woodford kerogen (type II)
o
Barnett (R o = 2.01%)
Cameo coal (type III)
0 Green river kerogen (type I) 0.2 0 Barnett (R = 0.81%)
0 5 10 15 0 5 10 15
Pressure (MPa) Pressure (MPa)
FIGURE 6.3 Effect of organic matter type (a) and maturity (b) on adsorbed gas capacity (data from Zhang et al., 2012).