
Page 138 - Fundamentals of Gas Shale Reservoirs
P. 138
118 PETROPHYSICAL EVALUATION OF GAS SHALE RESERVOIRS
pore volume or effective porosity, pore size distribution influence amount of porosity developed during thermal trans
(PSD), pore shape, and specific surface area. formation. Loucks et al. (2012) proposed that type II kerogen
An inverse relationship exists between pore size and surface may be more prone to the development of OM pores than type
area (Beliveau, 1993). Recent study by Labani et al. (2013) III kerogen due to the higher hydrogen content. On the other
on the potential gas shales from Western Australia (WA) has hand, TOC content can affect on the amount of adsorbed gas
shown that the micropores have a higher contribution to sur capacity; therefore, it could be a controlling factor for the total
face area than mesopores, whereas macropores contribute gas content as well (Jacobi et al., 2008).
the least. Organic matter (OM) characteristics (quantity, Thermal maturity is an important parameter for
quality, and maturity of OM) and mineralogical composition commercial gas production if the shale has considerable
control micro/mesopore volume. For the gas shales studied organic content. The common viewpoint for mapping sweet
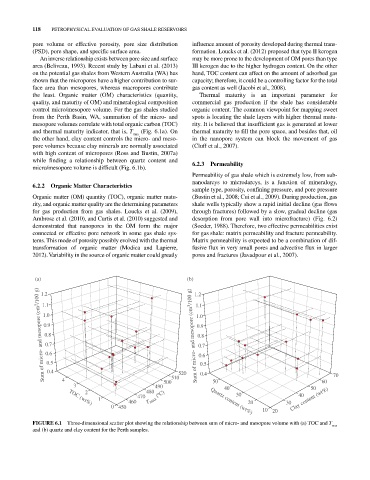
from the Perth Basin, WA, summation of the micro‐ and spots is locating the shale layers with higher thermal matu
mesopore volumes correlate with total organic carbon (TOC) rity. It is believed that insufficient gas is generated at lower
and thermal maturity indicator, that is, T max (Fig. 6.1a). On thermal maturity to fill the pore space, and besides that, oil
the other hand, clay content controls the micro‐ and meso in the nanopore system can block the movement of gas
pore volumes because clay minerals are normally associated (Cluff et al., 2007).
with high content of micropores (Ross and Bustin, 2007a)
while finding a relationship between quartz content and 6.2.3 Permeability
micro/mesopore volume is difficult (Fig. 6.1b).
Permeability of gas shale which is extremely low, from sub
nanodarcys to microdarcys, is a function of mineralogy,
6.2.2 Organic Matter Characteristics
sample type, porosity, confining pressure, and pore pressure
Organic matter (OM) quantity (TOC), organic matter matu (Bustin et al., 2008; Cui et al., 2009). During production, gas
rity, and organic matter quality are the determining parameters shale wells typically show a rapid initial decline (gas flows
for gas production from gas shales. Loucks et al. (2009), through fractures) followed by a slow, gradual decline (gas
Ambrose et al. (2010), and Curtis et al. (2010) suggested and desorption from pore wall into microfracture) (Fig. 6.2)
demonstrated that nanopores in the OM form the major (Soeder, 1988). Therefore, two effective permeabilities exist
connected or effective pore network in some gas shale sys for gas shale: matrix permeability and fracture permeability.
tems. This mode of porosity possibly evolved with the thermal Matrix permeability is expected to be a combination of dif
transformation of organic matter (Modica and Lapierre, fusive flux in very small pores and advective flux in larger
2012). Variability in the source of organic matter could greatly pores and fractures (Javadpour et al., 2007).
(a) (b)
Sum of micro- and mesopore (cm 3 /100 g) 0.8 Sum of micro- and mesopore (cm 3 /100 g) 0.8
1.2 1.2
1.1 1.1
1.0 1.0
0.9 0.9
0.7
0.7
0.6
0.6
0.5
0.4
0.4
4
3 490 500 510 520 0.5 50 40 50 60 70
2 480 30 40
1 460 470 T max (ºC) Quartz content (wt%) 30 Clay content (wt%)
20
TOC (wt%)
0 450 10 20
FIGURE 6.1 Three‐dimensional scatter plot showing the relationship between sum of micro‐ and mesopore volume with (a) TOC and T max
and (b) quartz and clay content for the Perth samples.