
Page 133 - Fundamentals of Gas Shale Reservoirs
P. 133
CONCLUSIONS 113
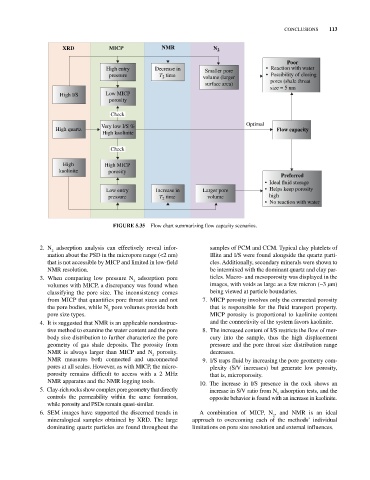
XRD MICP NMR N 2
Poor
High entry Decrease in Smaller pore • Reaction with water
pressure T time volume (larger • Possibility of closing
2
surface area) pores (shale throat
size = 5 nm
High I/S Low MICP
porosity
Check
Very low I/S % Optimal
High quartz Flow capacity
High kaolinite
Check
High High MICP
kaolinite porosity
Preferred
• Ideal fluid storage
Low entry Increase in Larger pore • Helps keep porosity
pressure T 2 time volume high
• No reaction with water
FIGurE 5.35 Flow chart summarizing flow capacity scenarios.
2. N adsorption analysis can effectively reveal infor samples of PCM and CCM. Typical clay platelets of
2
mation about the PSD in the micropore range (<2 nm) Illite and I/S were found alongside the quartz parti
that is not accessible by MICP and limited in low‐field cles. Additionally, secondary minerals were shown to
NMR resolution. be intermixed with the dominant quartz and clay par
3. When comparing low pressure N adsorption pore ticles. Macro‐ and mesoporosity was displayed in the
2
volumes with MICP, a discrepancy was found when images, with voids as large as a few micron (~3 µm)
classifying the pore size. The inconsistency comes being viewed at particle boundaries.
from MICP that quantifies pore throat sizes and not 7. MICP porosity involves only the connected porosity
the pore bodies, while N pore volumes provide both that is responsible for the fluid transport property.
2
pore size types. MICP porosity is proportional to kaolinite content
4. It is suggested that NMR is an applicable nondestruc and the connectivity of the system favors kaolinite.
tive method to examine the water content and the pore 8. The increased content of I/S restricts the flow of mer
body size distribution to further characterize the pore cury into the sample, thus the high displacement
geometry of gas shale deposits. The porosity from pressure and the pore throat size distribution range
NMR is always larger than MICP and N porosity. decreases.
2
NMR measures both connected and unconnected 9. I/S traps fluid by increasing the pore geometry com
pores at all scales. However, as with MICP, the micro plexity (S/V increases) but generate low porosity,
porosity remains difficult to access with a 2 MHz that is, microporosity.
NMR apparatus and the NMR logging tools. 10. The increase in I/S presence in the rock shows an
5. Clay‐rich rocks show complex pore geometry that directly increase in S/V ratio from N adsorption tests, and the
2
controls the permeability within the same formation, opposite behavior is found with an increase in kaolinite.
while porosity and PSDs remain quasi‐similar.
6. SEM images have supported the discerned trends in A combination of MICP, N , and NMR is an ideal
2
mineralogical samples obtained by XRD. The large approach to overcoming each of the methods’ individual
dominating quartz particles are found throughout the limitations on pore size resolution and external influences.