
Page 129 - Fundamentals of Gas Shale Reservoirs
P. 129
DISCUSSION 109
5.7.5.1 MICP Porosity and the Presence of Clays Two as kaolinite increases. If we compare samples 21 and 25, we
groups of samples were identified from capillary pressure can see that sample 25 has 13.8% kaolinite, and sample 21
profiles, showing distinct entry pressures at low pressure has a twofold higher concentration at 26.8%. The amount of
and pore saturation at the highest pressure of mercury N adsorbed in mmol/g increased from 0.27 (sample 25) to
2
injection. These two groups are distinctive in their content 0.77 (sample 20).
of I/S clays. The dominant group, mostly comprising PCM This behavior is also confirmed in samples 8, 13, and 27,
and PKM formations, with high I/S content, records high where the I/S‐to‐kaolinite ratio effect ranges from high to
entry pressure due to low pore throat radius. The second low. At a low ratio of I/S to kaolinite (i.e., high kaolinite
group of samples (CCM) with low I/S (but high kaolinite) content), the separation and quantity of N adsorbed is large.
2
has lower entry pressure and never reaches full saturation, In other words, if the desorption profile is similar to the
with up to 60,000 psi of pressure applied on the mercury. adsorption profile, the N is adsorbed at the same rate and
2
This illustrates that I/S clays are prone to degrade fluid amount as increasing pressure is released during the desorp
flow efficiency much more than kaolinite‐rich clay forma tion process. When a separation appears between the N pro
2
tions, as shown in the I/S that clogs part of the pore throats, files, typically more N is released during desorption than
2
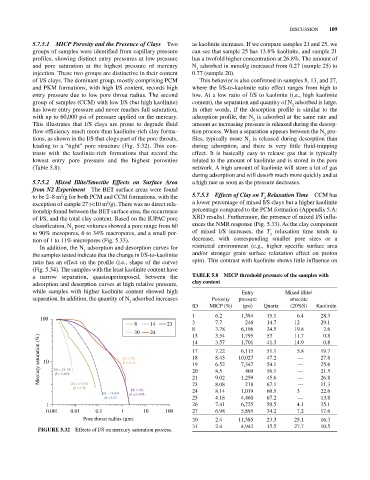
leading to a “tight” pore structure (Fig. 5.32). This con during adsorption, and there is very little fluid‐trapping
trasts with the kaolinite‐rich formations that record the effect. It is basically easy to release gas that is typically
lowest entry pore pressure and the highest porosities related to the amount of kaolinite and is stored in the pore
(Table 5.8). network. A high amount of kaolinite will store a lot of gas
during adsorption and will desorb much more quickly and at
5.7.5.2 Mixed Illite/Smectite Effects on Surface Area a high rate as soon as the pressure decreases.
from N2 Experiment The BET surface areas were found
2
to be 2–8 m /g for both PCM and CCM formations, with the 5.7.5.3 Effects of Clay on T Relaxation Time CCM has
2
2
exception of sample 27 (<10 m /g). There was no direct rela a lower percentage of mixed I/S clays but a higher kaolinite
tionship found between the BET surface area, the occurrence percentage compared to the PCM formation (Appendix 5.A:
of I/S, and the total clay content. Based on the IUPAC pore XRD results). Furthermore, the presence of mixed I/S influ
classification, N pore volumes showed a pore range from 60 ences the NMR response (Fig. 5.33). As the clay component
2
to 90% mesopores, 6 to 34% macropores, and a small por of mixed I/S increases, the T relaxation time tends to
2
tion of 1 to 11% micropores (Fig. 5.33). decrease, with corresponding smaller pore sizes or a
In addition, the N adsorption and desorption curves for restricted environment (e.g., higher specific surface area
2
the samples tested indicate that the change in I/S‐to‐kaolinite and/or stronger grain surface relaxation effect on proton
ratio has an effect on the profile (i.e., shape of the curve) spin). This contrast with kaolinite shows little influence on
(Fig. 5.34). The samples with the least kaolinite content have
a narrow separation, quasisuperimposed, between the TabLE 5.8 mICP threshold pressure of the samples with
adsorption and desorption curves at high relative pressure, clay content
while samples with higher kaolinite content showed high Entry Mixed illite/
separation. In addition, the quantity of N adsorbed increases Porosity pressure smectite
2
ID MICP (%) (psi) Quartz (20%S) Kaolinite
1 6.2 1,394 15.1 6.4 28.3
100
8 14 23 3 7.7 246 14.7 12 29.1
8 3.78 6,196 24.5 19.8 2.6
30 24 13 3.54 1,795 53 11.7 0.8
Mercury saturation (%) 10 I/S = 25.1% I/S = 3% 17 7.22 10,027 51.1 5.8 19.7
41.3
1,701
3.57
14
14.9
0.8
6,115
—
8.43
18
27.8
47.2
Ø =8.14
—
7,347
25.6
19
54.1
6.52
—
56.1
8.5
20
21.5
469
Ø =2.40%
218
—
11.3
67.1
23
8.08
I/S = 19.8%
Ø =3.78 I/S = 0% 21 9.02 1,259 45.6 — 26.8
I/S = 14.9% Ø =8.08% 24 8.14 1,019 60.5 3 22.6
Ø =3.57 25 4.18 4,460 67.2 — 13.8
1 26 7.41 6,725 50.5 4.1 25.1
0.001 0.01 0.1 1 10 100 27 6.98 5,895 34.2 7.2 17.6
Pore throat radius ( m) 30 2.4 11,585 23.3 25.1 16.3
31 2.4 4,942 15.5 27.7 10.5
FIGurE 5.32 Effects of I/S on mercury saturation process.