Page 125 - Fundamentals of Gas Shale Reservoirs
P. 125

DISCUSSION   105
                               8                                 9                                10
              0.15
              Normalized PV  0.1


               0.5

                 0                                                                  0
                              12                                 13                               14
              0.15
              Normalized PV  0.05
               0.1


                 0            17                                 18                               20
              0.15
              Normalized PV  0.05
               0.1


                 0            21                                 23                 0             24
              0.15
              Normalized PV  0.05
               0.1


                 0            25                                 26                 0             27
              0.15
              Normalized PV  0.05
               0.1


                 0                                0                                 0
                       0.01    1     100                  0.01    1     100               0.01    1     100
                         Pore diameter (
m)                 Pore diameter (
m)             Pore diameter (
m)
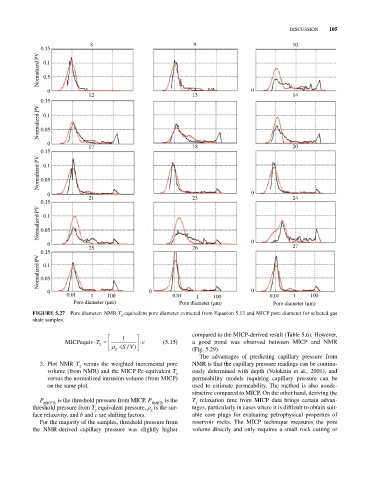
            FIGurE 5.27  Pore diameter: NMR T ‐equivalent pore diameter extracted from Equation 5.13 and MICP pore diameter for selected gas
                                         2
            shale samples.
                                                                 compared to the MICP‐derived result (Table 5.6). However,
                                         1
                       MICPequiv T 2            c      (5.15)    a good trend was observed between MICP and NMR
                                          SV)
                                       2  (/                     (Fig. 5.29).
                                                                   The advantages of predicting capillary pressure from
              3.  Plot NMR  T  versus the weighted incremental pore   NMR is that the capillary pressure readings can be continu­
                           2
                 volume (from NMR) and the MICP Pc‐equivalent T    ously determined with depth (Volokitin et al., 2001), and
                                                           2
                 versus the normalized intrusion volume (from MICP)   permeability models requiring capillary pressure can be
                 on the same plot.                               used to estimate permeability. The method is also nonde­
                                                                 structive compared to MICP. On the other hand, deriving the
              P MICPTh  is the threshold pressure from MICP, P NMRTh  is the   T   relaxation  time  from  MICP  data  brings  certain  advan­
                                                                  2
            threshold pressure from T  equivalent pressure, ρ  is the sur­  tages, particularly in cases where it is difficult to obtain suit­
                                2
                                                   2
            face relaxivity, and b and c are shifting factors.   able core plugs for evaluating petrophysical properties of
              For the majority of the samples, threshold pressure from   reservoir rocks.  The MICP technique measures the pore
            the NMR‐derived capillary pressure was slightly higher   volume directly and only requires a small rock cutting or
   120   121   122   123   124   125   126   127   128   129   130