
Page 130 - Fundamentals of Gas Shale Reservoirs
P. 130
110 PORE GEOMETRY IN GAS SHALE RESERVOIRS
600
500 R = 0.5651 R = 0.5183
2
2
S/V ratio (N 2 adsorption) 300
400
200
100
0
15
2
2
R = 0.5049 R = 0.7679
MICP porosity (%) 5
10
0
5
2
4 R = 0.1781
2
R = 0.5598
T 2 peak (ms) 3 2
1
0
0 10 20 30 0 10 20 30
Kaolinite (%) Mixed illite/smectite (%)
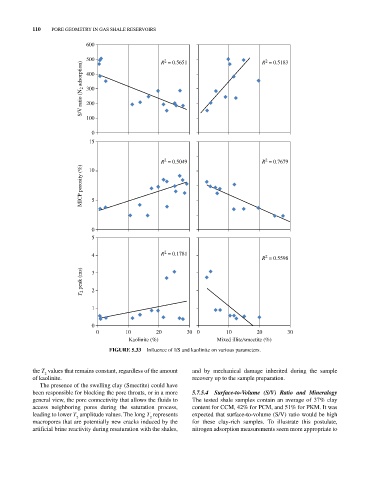
FIGurE 5.33 Influence of I/S and kaolinite on various parameters.
the T values that remains constant, regardless of the amount and by mechanical damage inherited during the sample
2
of kaolinite. recovery up to the sample preparation.
The presence of the swelling clay (Smectite) could have
been responsible for blocking the pore throats, or in a more 5.7.5.4 Surface‐to‐Volume (S/V) Ratio and Mineralogy
general view, the pore connectivity that allows the fluids to The tested shale samples contain an average of 37% clay
access neighboring pores during the saturation process, content for CCM, 42% for PCM, and 51% for PKM. It was
leading to lower T amplitude values. The long T represents expected that surface‐to‐volume (S/V) ratio would be high
2
2
macropores that are potentially new cracks induced by the for these clay‐rich samples. To illustrate this postulate,
artificial brine reactivity during resaturation with the shales, nitrogen adsorption measurements seem more appropriate to