
Page 127 - Fundamentals of Gas Shale Reservoirs
P. 127
DISCUSSION 107
fragments; results are obtained relatively quickly with rea Partially saturated Brine saturated
sonable accuracy, and very high capillary pressure ranges 12
can be achieved.
10
5.7.3 Pore‐body to Pore‐Throat Size ratio: Pore 8
Geometry Complexity T cutoff ØFFI ØNMR
2
Pore‐body to pore‐throat ratio is an important characteristic Incremental porosity (%) 6
that controls fluid flow. The connectivity in the pore system
can be represented by the pore‐body to pore‐throat size ratio; 4
the lower the ratio, the lower the connectivity, and so the ØBVI
lower the permeability/fluid flow will be. Determining the 2
exact physical shape of the pores is both difficult and time‐
consuming, and it also requires demanding test equipment. 0
The pore body–pore throat size ratio was derived from the 0.01 0.1 1 10 100 1,000 10,000 100,000
Coates equation (Coates et al., 1999): T (ms)
2
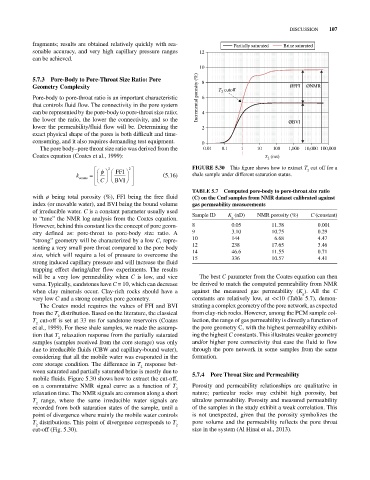
2 FFI 2 FIGurE 5.30 This figure shows how to extract T cut off for a
2
k coates (5.16) shale sample under different saturation status.
C BVI
TabLE 5.7 Computed pore‐body to pore‐throat size ratio
with ø being total porosity (%), FFI being the free fluid (C) on the Cmf samples from Nmr dataset calibrated against
index (or movable water), and BVI being the bound volume gas permeability measurements
of irreducible water. C is a constant parameter usually used
to “tune” the NMR log analysis from the Coates equation. Sample ID K (nD) NMR porosity (%) C (constant)
g
However, behind this constant lies the concept of pore geom 8 0.05 11.38 0.001
etry defined as: pore‐throat to pore‐body size ratio. A 9 3.10 10.75 0.29
“strong” geometry will be characterized by a low C, repre 10 144 6.68 4.47
senting a very small pore throat compared to the pore body 12 238 17.65 3.46
size, which will require a lot of pressure to overcome the 14 46.6 11.55 0.71
10.57
336
15
4.41
strong induced capillary pressure and will increase the fluid
trapping effect during/after flow experiments. The results
will be a very low permeability when C is low, and vice The best C parameter from the Coates equation can then
versa. Typically, sandstones have C = 10, which can decrease be derived to match the computed permeability from NMR
when clay minerals occur. Clay‐rich rocks should have a against the measured gas permeability (K ). All the C
g
very low C and a strong complex pore geometry. constants are relatively low, at <<10 (Table 5.7), demon
The Coates model requires the values of FFI and BVI strating a complex geometry of the pore network, as expected
from the T distribution. Based on the literature, the classical from clay‐rich rocks. However, among the PCM sample col
2
T cut‐off is set at 33 ms for sandstone reservoirs (Coates lection, the range of gas permeability is directly a function of
2
et al., 1999). For these shale samples, we made the assump the pore geometry C, with the highest permeability exhibit
tion that T relaxation response from the partially saturated ing the highest C constants. This illustrates weaker geometry
2
samples (samples received from the core storage) was only and/or higher pore connectivity that ease the fluid to flow
due to irreducible fluids (CBW and capillary‐bound water), through the pore network in some samples from the same
considering that all the mobile water was evaporated in the formation.
core storage condition. The difference in T response bet
2
ween saturated and partially saturated brine is mostly due to 5.7.4 Pore Throat Size and Permeability
mobile fluids. Figure 5.30 shows how to extract the cut‐off,
on a commutative NMR signal curve as a function of T Porosity and permeability relationships are qualitative in
2
relaxation time. The NMR signals are common along a short nature; particular rocks may exhibit high porosity, but
T range, where the same irreducible water signals are ultralow permeability. Porosity and measured permeability
2
recorded from both saturation states of the sample, until a of the samples in the study exhibit a weak correlation. This
point of divergence where mainly the mobile water controls is not unexpected, given that the porosity symbolizes the
T distributions. This point of divergence corresponds to T pore volume and the permeability reflects the pore throat
2
2
cut‐off (Fig. 5.30). size in the system (Al Hinai et al., 2013).