
Page 123 - Fundamentals of Gas Shale Reservoirs
P. 123
DISCUSSION 103
1,000 methods. This scale of difference with NMR has also been
kg kl described by other research that has analyzed mudstones
100 (Hildenbrand and Urai, 2003). Possible explanations of
these higher values of porosity from NMR come from the
10
Permeability (nD) 0.1 (i) NMR measures both connected and isolated pores.
fact that
1
Further, MICP porosity measures connected pores
and thus misses out on the pores located within the
0.01
grains and the clay‐bound water spaces.
0.001 (ii) Samples were dried out for MICP experiments,
inducing potential clay shrinkages, while the NMR
0.0001
8 9 10 11 12 13 14 15 16 re‐saturation with artificial brine was prone to
Sample ID generate clay swelling and cracks.
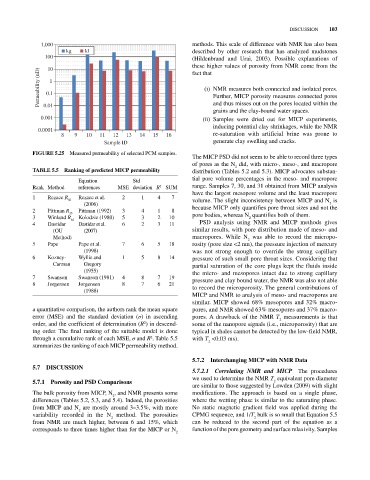
FIGurE 5.25 Measured permeability of selected PCM samples.
The MICP PSD did not seem to be able to record three types
of pores as the N did, with micro‐, meso‐, and macropore
2
TabLE 5.5 ranking of predicted mICP permeability distribution (Tables 5.2 and 5.3). MICP advocates substan
Equation Std tial pore volume percentages in the meso‐ and macropore
Rank Method references MSE deviation R 2 SUM range. Samples 7, 30, and 31 obtained from MICP analysis
have the largest mesopore volume and the least macropore
1 Rezaee R Rezaee et al. 2 1 4 7
50 volume. The slight inconsistency between MICP and N is
(2006) 2
2 Pittman R 25 Pittman (1992) 3 4 1 8 because MICP only quantifies pore throat sizes and not the
3 Winland R 35 Kolodzie (1980) 5 3 2 10 pore bodies, whereas N quantifies both of them.
2
4 Dastidar Dastidar et al. 6 2 3 11 PSD analysis using NMR and MICP methods gives
(OU (2007) similar results, with pore distribution made of meso‐ and
Method) macropores. While N was able to record the micropo
2
5 Pape Pape et al. 7 6 5 18 rosity (pore size <2 nm), the pressure injection of mercury
(1998) was not strong enough to override the strong capillary
6 Kozney‐ Wyllie and 1 5 8 14 pressure of such small pore throat sizes. Considering that
Carman Gregory partial saturation of the core plugs kept the fluids inside
(1955) the micro‐ and mesopores intact due to strong capillary
7 Swanson Swanson (1981) 4 8 7 19 pressure and clay bound water, the NMR was also not able
8 Jorgensen Jorgensen 8 7 6 21
(1988) to record the microporosity. The general contributions of
MICP and NMR to analysis of meso‐ and macropores are
similar. MICP showed 68% mesopores and 32% macro
a quantitative comparison, the authors rank the mean square pores, and NMR showed 63% mesopores and 37% macro
error (MSE) and the standard deviation (σ) in ascending pores. A drawback of the NMR T measurements is that
2
order, and the coefficient of determination (R ) in descend some of the nanopore signals (i.e., microporosity) that are
2
ing order. The final ranking of the suitable model is done typical in shales cannot be detected by the low‐field NMR,
2
through a cumulative rank of each MSE, σ and R . Table 5.5 with T <0.03 ms).
2
summarizes the ranking of each MICP permeability method.
5.7.2 Interchanging mICP with Nmr Data
5.7 DISCuSSION
5.7.2.1 Correlating NMR and MICP The procedures
we used to determine the NMR T equivalent pore diameter
5.7.1 Porosity and PSD Comparisons 2
are similar to those suggested by Lowden (2009) with slight
The bulk porosity from MICP, N , and NMR presents some modifications. The approach is based on a single phase,
2
differences (Tables 5.2, 5.3, and 5.4). Indeed, the porosities where the wetting phase is similar to the saturating phase.
from MICP and N are mostly around 3–3.5%, with more No static magnetic gradient field was applied during the
2
variability recorded in the N method. The porosities CPMG sequence, and 1/T bulk is so small that Equation 5.5
2 2
from NMR are much higher, between 6 and 15%, which can be reduced to the second part of the equation as a
corresponds to three times higher than for the MICP or N function of the pore geometry and surface relaxivity. Samples
2