Page 120 - Fundamentals of Gas Shale Reservoirs
P. 120

100   PORE GEOMETRY IN GAS SHALE RESERVOIRS

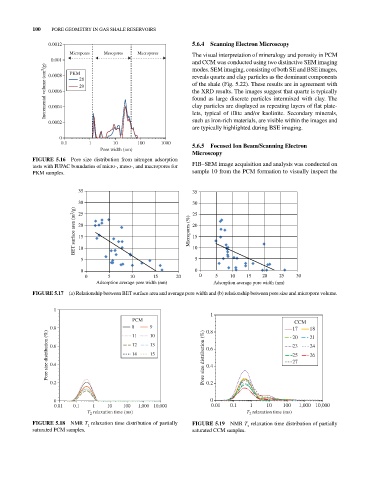
                 0.0012                                          5.6.4  Scanning Electron microscopy
                        Micropores  Mesopores  Macropores        The visual interpretation of mineralogy and porosity in PCM
                  0.001  PKM                                     and CCM was conducted using two distinctive SEM imaging
                Incremental volume (cm 3 /g)  0.0006  28         reveals quartz and clay particles as the dominant components
                                                                 modes. SEM imaging, consisting of both SE and BSE images,
                 0.0008
                                                                 of the shale (Fig. 5.22). These results are in agreement with
                           29
                                                                 the XRD results. The images suggest that quartz is typically
                                                                 found as large discrete particles intermixed with clay. The
                                                                 clay particles are displayed as repeating layers of flat plate­
                 0.0004
                                                                 such as iron‐rich materials, are visible within the images and
                 0.0002                                          lets, typical of illite and/or kaolinite. Secondary minerals,
                                                                 are typically highlighted during BSE imaging.
                     0
                     0.1      1       10      100     1000       5.6.5  Focused Ion beam/Scanning Electron
                                  Pore width (nm)
                                                                 microscopy
            FIGurE  5.16  Pore size distribution from nitrogen adsorption
            tests with IUPAC boundaries of micro‐, meso‐, and macropores for   FIB–SEM image acquisition and analysis was conducted on
            PKM samples.                                         sample 10 from the PCM formation to visually inspect the


                           35                                    35
                           30                                    30
                          BET surface area (m 2 /g)  20         Micropores (%) 25
                           25
                                                                 20
                                                                 15
                           15
                           10
                            5                                    10 5
                            0                                    0
                             0       5      10      15     20      0    5    10   15    20   25    30
                                 Adsorption average pore width (nm)     Adsorption average pore width (nm)
            FIGurE 5.17  (a) Relationship between BET surface area and average pore width and (b) relationship between pore size and micropore volume.

                   1
                                                                       1
                                             PCM                                                  CCM
                  0.8                        8 11  9 10              0.8                          17   18
                 Pore size distribution (%)  0.6  12  13            Pore size distribution (%)  0.6  23  24
                                                                                                       21
                                                                                                  20
                                                   15
                                             14
                                                                                                  25
                                                                                                       26
                                                                                                  27
                  0.4
                                                                     0.4
                  0.2                                                0.2

                   0                                                   0
                   0.01  0.1    1   10    100  1,000 10,000            0.01  0.1    1    10    100  1,000 10,000
                              T 2  relaxation time (ms)                            T 2  relaxation time (ms)

            FIGurE 5.18  NMR T  relaxation time distribution of partially   FIGurE 5.19  NMR T  relaxation time distribution of partially
                              2
                                                                                   2
            saturated PCM samples.                               saturated CCM samples.
   115   116   117   118   119   120   121   122   123   124   125