
Page 116 - Fundamentals of Gas Shale Reservoirs
P. 116
96 PORE GEOMETRY IN GAS SHALE RESERVOIRS
5.6 rESuLTS 100,000
5.6.1 Pore Size Distribution from mICP Experiments 10,000
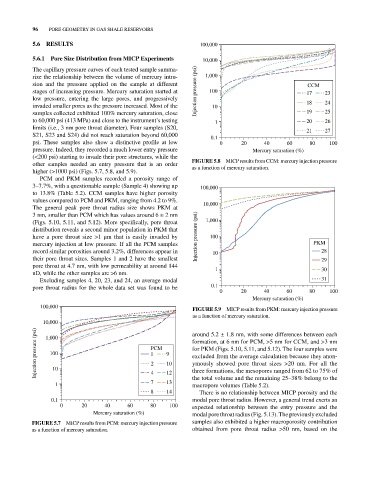
The capillary pressure curves of each tested sample summa
rize the relationship between the volume of mercury intru 1,000
sion and the pressure applied on the sample at different CCM
stages of increasing pressure. Mercury saturation started at Injection pressure (psi) 100 17 23
low pressure, entering the large pores, and progressively
invaded smaller pores as the pressure increased. Most of the 10 18 24
samples collected exhibited 100% mercury saturation, close 19 25
to 60,000 psi (413 MPa) and close to the instrument’s testing 1 20 26
limits (i.e., 3 nm pore throat diameter). Four samples (S20, 21 27
S21, S23 and S24) did not reach saturation beyond 60,000 0.1
psi. These samples also show a distinctive profile at low 0 20 40 60 80 100
pressure. Indeed, they recorded a much lower entry pressure Mercury saturation (%)
(<200 psi) starting to invade their pore structures, while the
other samples needed an entry pressure that is an order FIGurE 5.8 MICP results from CCM: mercury injection pressure
as a function of mercury saturation.
higher (>1000 psi) (Figs. 5.7, 5.8, and 5.9).
PCM and PKM samples recorded a porosity range of
3–7.7%, with a questionable sample (Sample 4) showing up 100,000
to 13.8% (Table 5.2). CCM samples have higher porosity
values compared to PCM and PKM, ranging from 4.2 to 9%. 10,000
The general peak pore throat radius size shows PKM at
3 nm, smaller than PCM which has values around 6 ± 2 nm
(Figs. 5.10, 5.11, and 5.12). More specifically, pore throat 1,000
distribution reveals a second minor population in PKM that
have a pore throat size >1 µm that is easily invaded by Injection pressure (psi) 100
mercury injection at low pressure. If all the PCM samples PKM
record similar porosities around 3.2%, differences appear in 10 28
their pore throat sizes. Samples 1 and 2 have the smallest 29
pore throat at 4.7 nm, with low permeability at around 144 1 30
nD, while the other samples are >6 nm.
Excluding samples 4, 20, 23, and 24, an average modal 31
pore throat radius for the whole data set was found to be 0.1
0 20 40 60 80 100
Mercury saturation (%)
100,000 FIGurE 5.9 MICP results from PKM: mercury injection pressure
as a function of mercury saturation.
10,000 around 5.2 ± 1.8 nm, with some differences between each
Injection pressure (psi) 100 PCM 9 formation, at 6 nm for PCM, >5 nm for CCM, and >3 nm
1,000
for PKM (Figs. 5.10, 5.11, and 5.12). The four samples were
1
excluded from the average calculation because they anon
ymously showed pore throat sizes >20 nm. For all the
10
2
10
the total volume and the remaining 25–38% belong to the
13
1 7 4 12 three formations, the mesopores ranged from 62 to 75% of
macropore volumes (Table 5.2).
8 14 There is no relationship between MICP porosity and the
0.1 modal pore throat radius. However, a general trend exerts an
0 20 40 60 80 100 expected relationship between the entry pressure and the
Mercury saturation (%) modal pore throat radius (Fig. 5.13). The previously excluded
FIGurE 5.7 MICP results from PCM: mercury injection pressure samples also exhibited a higher macroporosity contribution
as a function of mercury saturation. obtained from pore throat radius >50 nm, based on the