
Page 118 - Fundamentals of Gas Shale Reservoirs
P. 118
98 PORE GEOMETRY IN GAS SHALE RESERVOIRS
IUPAC classification. Note that microporosity (<2 nm pore Pore volumes and surface areas obtained from N tests
2
size) is not achievable by MICP method. show a relatively narrow range both for the PCM and CCM
formations, with the exception of samples 17 and 27 from
formation CCM. The average BET surface area is similar
5.6.2 Pore Size Distribution from Nitrogen adsorption for the two tested formations (CCM and PCM) at around
Experiments
2
5.5 ± 2 mm /g. However, the total pore volume for CCM is
A summary of the results collected from low pressure higher than it is for PCM, with them measuring 2 ± 0.9
3
adsorption measurements and the IUPAC pore percentages cm /100 g and 1.39 ± 0.2 cm /100 g, respectively. All of
3
are shown in Table 5.3. these samples are characterized by a very high contribu
The average pore radius for the whole data set was found tion of the mesopore size, at 78.5 ± 7.3% of the total
to be around 7.5 ± 2.9 nm, with CCM showing larger pore porosity (Figs. 5.14, 5.15, and 5.16).
sizes (9.2 ± 2.4 nm) compared to PCM (5.2 ± 1.5 nm). There is an inverse relationship between pore size and
BET surface area, and all samples show an increase in
micropore volume with decreasing average pore diameter
0.2
(Fig. 5.17).
PKM
28 5.6.3 Nmr T relaxation Time
2
0.15 29 In NMR, porosity is directly related to the amount of
Pore volume (fraction) 0.1 31 atoms are proportional to proton density and correspond to
30
hydrogen atom (protons) present in the sample. The hydrogen
the initial amplitude of the spin. Under partially saturated
conditions, the average porosity was found to be 4 ± 1.3%.
The samples have systematic monomodal distribution, with
a relaxation time (T ) centred around 0.35 ± 0.03 ms
0.05
(Figs. 5.18 and 5.19). 2
After saturation, the previous population showed a shift
toward longer T , centred between 0.5 and 0.6 ms, with the
2
0 exception of samples 24 and 26 which showed a shift up to 3
0.001 0.01 0.1 1 10 100 ms (Figs. 5.20 and 5.21). This first population is defined as the
Pore throat radius ( m) short relaxation time (T ). A second population defined by
2s
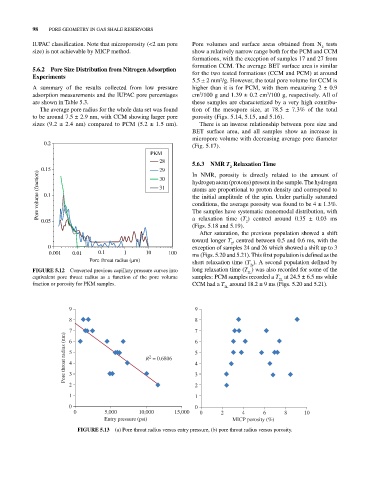
FIGurE 5.12 Converted previous capillary pressure curves into long relaxation time (T ) was also recorded for some of the
2L
equivalent pore throat radius as a function of the pore volume samples: PCM samples recorded a T at 24.5 ± 6.5 ms while
2L
fraction or porosity for PKM samples. CCM had a T around 18.2 ± 9 ms (Figs. 5.20 and 5.21).
2L
9 9
8 8
7 7 6
Pore throat radius (nm) 5 4 R = 0.6806 5 4
6
2
2 3 3 2
1 1
0 0
0 5,000 10,000 15,000 0 2 4 6 8 10
Entry pressure (psi) MICP porosity (%)
FIGurE 5.13 (a) Pore throat radius versus entry pressure, (b) pore throat radius versus porosity.