
Page 113 - Fundamentals of Gas Shale Reservoirs
P. 113
EXPERIMENTAL METHODOLOGY 93
1999; Gabriela and Lorne, 2000; Glorioso et al., 2003; SEM imaging was conducted using a Zeiss Neon 40EsB
Grunewald and Knight, 2011; Hidajat et al., 2003; Kenyon and Philips XL40. The Zeiss Neon 40EsB is equipped with a
et al., 1995; Minh and Sundararaman, 2006). field emission gun with a maximum extra‐high tension
NMR T relaxation time was conducted on 16 partially (EHT) voltage of 30 kV. Individual samples were mounted
2
saturated and brine‐saturated core‐plugs (3.8 cm diameter upon pin‐type mounts prior to coating with a thin layer of
and 4–8 cm long) using a low‐field Maran Ultra‐Spectrometer platinum, to ensure surface conductivity. Samples were
2 MHz from Oxford Ltd. Low‐field NMR is a nonde introduced into the SEM for secondary electron imaging
structive technique that involves the motion of the proton using an EHT of 5 kV. Mineralogy and pore size were visu
(Hydrogen 1H) occurring in water and hydrocarbon fluids ally identified with the resultant images.
relative to the porous rock. The relaxation time T was The FIB instrument works in a similar way to SEM;
2
+
acquired during a Carr–Purcell–Meiboom–Gill (CPMG) instead of a beam electron, FIB uses a Ga primary ion beam
spin‐echo pulse sequence (see Dimri et al., 2012 for more that hits the surface of the sample and sputters a small
details). The transverse relaxation time is mainly controlled amount of materials that leaves the surface as either
by the pore geometry and diffusion transport as secondary ions (i or i ) or neutral atoms (n ). The signal
+
0
−
from the sputtered ions or secondary electrons is collected to
2 form an image of the surface of the sample and gives
1 1 S D GTE (5.5) information on the topography and material characteristics
T T 2 V 12
2
2Bulk
(Fibics, 2011). The system works repetitively; first the
images are registered and are interpolated normally to the
where ρ is the surface relaxivity related to mineral interaction
2
with fluid (in Pm/s), T is the transverse NMR relaxation time, slice (direction) and the SEM beam creates a 2D image of
2
and T 2bulk is the transverse relaxation time of the bulk water only the sample. The ion beam removes a thin layer of material on
(in s), defined as a constant at a specific temperature and the surface of the sample, creating a new surface that is
constant water viscosity. S/V (in Pm ) is the ratio of pore aligned with the previous slice, the SEM then generates an
−1
surface to pore fluid volume and is defined as a pore geometry image again and the process is repeated (Butcher and
index. The last part of the equation represents the diffusion Lemmen, 2011).
aspect of the spin echo with D for the molecular diffusion coef A piece of ±20 × 5 mm size from the sample 10 was
ficient (in cm /s), γ being a constant of the gyromagnetic ratio embedded in resin and the surface was polished up to 1200
2
of a proton in (in MHz/T), G being the field‐strength gradient grit. The sample was placed on an aluminium stub using a
(in G/cm), and TE being the inter‐echo spacing used in the silver dab and coated with silver and carbon to reduce elec
CPMG sequence. Since no static magnetic gradient field was tron charging and energy drift. The sample was placed on the
applied during the CPMG sequence, Equation 5.4 can be sim dual beam stage at an angle of 52 degrees and a working
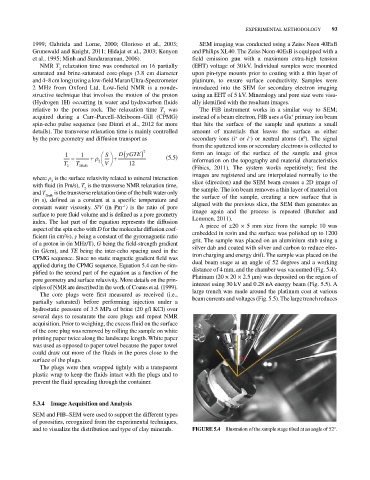
plified to the second part of the equation as a function of the distance of 4 mm, and the chamber was vacuumed (Fig. 5.4).
pore geometry and surface relaxivity. More details on the prin Platinum (20 × 20 × 2.5 µm) was deposited on the region of
ciples of NMR are described in the work of Coates et al. (1999). interest using 30 kV and 0.28 nA energy beam (Fig. 5.5). A
The core plugs were first measured as received (i.e., large trench was made around the platinum coat at various
partially saturated) before performing injection under a beam currents and voltages (Fig. 5.5). The large trench reduces
hydrostatic pressure of 3.5 MPa of brine (20 g/l KCl) over
several days to resaturate the core plugs and repeat NMR
acquisition. Prior to weighing, the excess fluid on the surface
of the core plug was removed by rolling the sample on white
printing paper twice along the landscape length. White paper
was used as opposed to paper towel because the paper towel
could draw out more of the fluids in the pores close to the
surface of the plugs. 52°
The plugs were then wrapped tightly with a transparent
plastic wrap to keep the fluids intact with the plugs and to
prevent the fluid spreading through the container.
5.3.4 Image acquisition and analysis
SEM and FIB–SEM were used to support the different types
of porosities, recognized from the experimental techniques,
and to visualize the distribution and type of clay minerals. FIGurE 5.4 Illustration of the sample stage tilted at an angle of 52°.