
Page 111 - Fundamentals of Gas Shale Reservoirs
P. 111
EXPERIMENTAL METHODOLOGY 91
TabLE 5.1 Laboratory methods applied 5.3 EXPErImENTaL mETHODOLOGy
Sample Depth
Formation number (m) XRD MICP N NMR SEM 5.3.1 Capillary Pressure Profile
2
PCm 1 1618 x x Gas shale reservoirs play a major role in exploration and
2 1614 x x production because they are deemed to be both source rock
3 400.8 x and cap rock. They display good sealing characteristics
4 2650 x due to their small pore throats, which are responsible for
5 3771 x x creating high capillary pressures (Al‐Bazali et al., 2005).
6 3792 x x To understand capillary pressure behavior, mercury intru
7 2294 x sion experiments are normally conducted.
8 2780 x x x x x The MICP technique is used to determine various quantifi
9 2782 x x x x able aspects of a porous medium such as pore diameter, total
10 2790 x x
11 2817 x x pore volume, surface area, and bulk and absolute densities
12 2825 x x x (Burdine et al., 1950; Chen and Song, 2002; Kale et al., 2010a, b)
13 2794 x x x x as a function of pressure, correlated with permeability in some
14 2806 x x x x x rocks (Dastidar et al., 2007; Ma et al., 1991; Owolabi and
15 2813 x x x Watson, 1993; Swanson, 1981) and rock typing in shale by
16 2831 x x x integrating geological cores (Kale et al., 2010a).
CCm 17 1947 x x x x MICP was performed on 24 dry samples of an average
18 1246 x x x x x weight of 8 g with a Micromeritics autopore IV porosimeter.
19 1384 x x x MICP provides the porosity of the connected pores from the
20 1152 x x x x x volume of mercury injected within the pore network under
21 1160 x x x x high pressure, and the capillary pressure curves from the
22 1650 x x x
23 1454 x x x x injected volume of mercury under incremental increase of
24 1410 x x x x applied pressure. Pore‐throat size distribution down to 3 nm
25 1855 x x x x in diameter (i.e., maximum of 60,000 psi) can be derived
26 1436 x x x x from the capillary pressure curves. The pore‐throat radius can
27 1949 x x x x be found by Laplace‐Washburn equation (Washburn, 1921):
PKm 28 3793 x x
29 3799 x x 2 cos
30 3800 x x R (5.1)
31 3793 x x P c
where P is the entry pressure (psi), σ is the interfacial
c
tension (dynes/cm), θ is the contact angle (degrees), and R is
the pore‐throat radius (um). The minimum capillary entry
Quartz
0 100 Formation CCM pressure is the capillary pressure at which the non‐wetting
Formation PCM
phase starts to displace the wetting phase, confined in the
10 90 Formation PKM largest pore throat within a water‐wet formation. The capil
20 80 lary entry pressure can be major, particularly for shales with
30 70 very small pore throats (permeability) (Al‐Bazali et al.,
2005). The entry pressure is inversely proportional to the
40 60
size of the pore in which mercury will intrude (radius).
50 50 Figure 5.3 shows the capillary pressure curve during the
60 40 injection process. At the lower injection pressure, the mer
cury starts to enter the large pores and then starts to plateau.
70 30
The bend “apex” or the inflection point proposed by Swanson
80 20
(1981) is where the pressure curve starts to have a steep
90 10 slope toward the higher capillary pressure, illustrating the
100 0 smaller pore throats, micropores, or nanopores when dealing
0 10 20 30 40 50 60 70 80 90 100 with tight gas or gas shale rocks.
Clays Non-clays However, mercury intrusion experiments alone do not pro
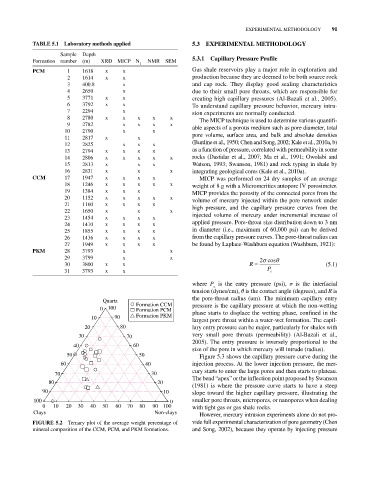
FIGurE 5.2 Ternary plot of the average weight percentage of vide full experimental characterization of pore geometry (Chen
mineral composition of the CCM, PCM, and PKM formations. and Song, 2002), because they operate by injecting pressure