
Page 110 - Fundamentals of Gas Shale Reservoirs
P. 110
90 PORE GEOMETRY IN GAS SHALE RESERVOIRS
rocks. Fissile and laminated attributes (Zahid et al., 2007)
distinguishes shale from other “mudstones.” That is, the rock Gas adsorption
is made up of many thin parallel layers, and the rock readily
splits into thin pieces along the layers. Mercury porosimeter
The systems are typically organically rich; a higher total
organic content (TOC) shale commonly has a higher adsorbed FIB/SEM
gas content (Boyer et al., 2006). Fracture stimulation is
required for the systems to economically produce gas (King,
2010). Fractures are created easily in silica‐rich and carbonate‐ Micro Meso Macro
rich shales when compared to clay‐rich shales, and total 0.1 1 10 100 1 100 1000
porosities are larger in clay‐rich shales than in silica‐rich Nanometer Micrometer
shales (Bustin et al., 2008; Ross and Marc Bustin, 2009). Pore diameter
One of the most important and difficult variables to deter
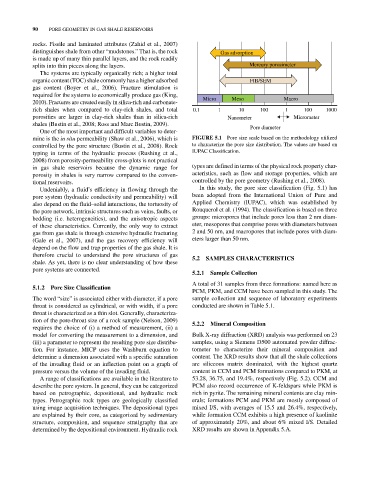
mine is the in situ permeability (Shaw et al., 2006), which is FIGurE 5.1 Pore size scale based on the methodology utilized
controlled by the pore structure (Bustin et al., 2008). Rock to characterize the pore size distribution. The values are based on
typing in terms of the hydraulic process (Rushing et al., IUPAC Classification.
2008) from porosity‐permeability cross‐plots is not practical
in gas shale reservoirs because the dynamic range for types are defined in terms of the physical rock property char
porosity in shales is very narrow compared to the conven acteristics, such as flow and storage properties, which are
tional reservoirs. controlled by the pore geometry (Rushing et al., 2008).
Undeniably, a fluid’s efficiency in flowing through the In this study, the pore size classification (Fig. 5.1) has
pore system (hydraulic conductivity and permeability) will been adopted from the International Union of Pure and
also depend on the fluid–solid interactions, the tortuosity of Applied Chemistry (IUPAC), which was established by
the pore network, intrinsic structures such as veins, faults, or Rouquerol et al. (1994). The classification is based on three
bedding (i.e. heterogeneities), and the anisotropic aspects groups: micropores that include pores less than 2 nm diam
of these characteristics. Currently, the only way to extract eter, mesopores that comprise pores with diameters between
gas from gas shale is through extensive hydraulic fracturing 2 and 50 nm, and macropores that include pores with diam
(Gale et al., 2007), and the gas recovery efficiency will eters larger than 50 nm.
depend on the flow and trap properties of the gas shale. It is
therefore crucial to understand the pore structures of gas 5.2 SamPLES CHaraCTErISTICS
shale. As yet, there is no clear understanding of how these
pore systems are connected.
5.2.1 Sample Collection
A total of 31 samples from three formations: named here as
5.1.2 Pore Size Classification
PCM, PKM, and CCM have been sampled in this study. The
The word “size” is associated either with diameter, if a pore sample collection and sequence of laboratory experiments
throat is considered as cylindrical, or with width, if a pore conducted are shown in Table 5.1.
throat is characterized as a thin slot. Generally, characteriza
tion of the pore‐throat size of a rock sample (Nelson, 2009) 5.2.2 mineral Composition
requires the choice of (i) a method of measurement, (ii) a
model for converting the measurement to a dimension, and Bulk X‐ray diffraction (XRD) analysis was performed on 23
(iii) a parameter to represent the resulting pore size distribu samples, using a Siemens D500 automated powder diffrac
tion. For instance, MICP uses the Washburn equation to tometer to characterize their mineral composition and
determine a dimension associated with a specific saturation content. The XRD results show that all the shale collections
of the invading fluid or an inflection point on a graph of are siliceous matrix dominated, with the highest quartz
pressure versus the volume of the invading fluid. content in CCM and PCM formations compared to PKM, at
A range of classifications are available in the literature to 53.28, 36.75, and 19.4%, respectively (Fig. 5.2). CCM and
describe the pore system. In general, they can be categorized PCM also record occurrence of K‐feldspars while PKM is
based on petrographic, depositional, and hydraulic rock rich in pyrite. The remaining mineral contents are clay min
types. Petrographic rock types are geologically classified erals; formations PCM and PKM are mostly composed of
using image acquisition techniques. The depositional types mixed I/S, with averages of 15.5 and 26.4%, respectively,
are explained by their core, as categorized by sedimentary while formation CCM exhibits a high presence of kaolinite
structure, composition, and sequence stratigraphy that are of approximately 20%, and about 6% mixed I/S. Detailed
determined by the depositional environment. Hydraulic rock XRD results are shown in Appendix 5.A.