
Page 114 - Fundamentals of Gas Shale Reservoirs
P. 114
94 PORE GEOMETRY IN GAS SHALE RESERVOIRS
(a) (b)
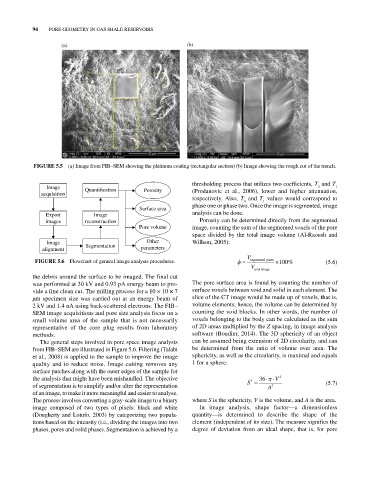
FIGurE 5.5 (a) Image from FIB–SEM showing the platinum coating (rectangular section) (b) Image showing the rough cut of the trench.
thresholding process that utilizes two coefficients, T and T
Image Quanti cation Porosity 0 1
acquisition (Prodanovic et al., 2006), lower and higher attenuation,
respectively. Also, T and T values would correspond to
0 1
phase one or phase two. Once the image is segmented, image
Surface area
Export Image analysis can be done.
images reconstruction Porosity can be determined directly from the segmented
Pore volume image, counting the sum of the segmented voxels of the pore
space divided by the total image volume (Al‐Raoush and
Image Segmentation Other Willson, 2005):
alignment parameters
V
FIGurE 5.6 Flowchart of general image analysis procedures. segmented pores 100% (5.6)
V
totalimage
the debris around the surface to be imaged. The final cut
was performed at 30 kV and 0.93 pA energy beam to pro The pore surface area is found by counting the number of
vide a fine clean cut. The milling process for a 10 × 10 × 7 surface voxels between void and solid in each element. The
µm specimen size was carried out at an energy beam of slice of the CT image would be made up of voxels, that is,
2 kV and 1.4 nA using back‐scattered electrons. The FIB– volume elements; hence, the volume can be determined by
SEM image acquisitions and pore size analysis focus on a counting the void blocks. In other words, the number of
small volume area of the sample that is not necessarily voxels belonging to the body can be calculated as the sum
representative of the core plug results from laboratory of 2D areas multiplied by the Z spacing, in image analysis
methods. software (Boudier, 2014). The 3D sphericity of an object
The general steps involved in pore space image analysis can be assumed being extension of 2D circularity, and can
from FIB–SEM are illustrated in Figure 5.6. Filtering (Talabi be determined from the ratio of volume over area. The
et al., 2008) is applied to the sample to improve the image sphericity, as well as the circularity, is maximal and equals
quality and to reduce noise. Image cutting removes any 1 for a sphere:
surface patches along with the outer edges of the sample for
the analysis that might have been mishandled. The objective 3 36 V 2
of segmentation is to simplify and/or alter the representation S A 3 (5.7)
of an image, to make it more meaningful and easier to analyse.
The process involves converting a gray‐scale image to a binary where S is the sphericity, V is the volume, and A is the area.
image composed of two types of pixels: black and white In image analysis, shape factor—a dimensionless
(Dougherty and Lotufo, 2003) by categorizing two popula quantity—is determined to describe the shape of the
tions based on the intensity (i.e., dividing the images into two element (independent of its size). The measure signifies the
phases, pores and solid phase). Segmentation is achieved by a degree of deviation from an ideal shape, that is, for pore