Page 119 - Fundamentals of Gas Shale Reservoirs
P. 119

RESULTS    99
            TabLE 5.3  Nitrogen adsorption results and pore volume percentages based on IuPaC classification from the gas shale collection

                                                                                   % DFT model (porosity)
                                             Total pore Vol.
                                  BET surface   (cm /100g) at   Average pore
                                                3
                                       2
            Formation  SAMPLE ID  area (m /g)  maximum pressure  radius (nm)  Micropore Vol.  Meso pore Vol.  Macropore Vol.
            PCm          8           5.4          1.54           5.7          5.4          85.7          8.9
                         9           7.6          1.67           4.4          4.4          93.0          2.7
                        11           2.3          0.99           8.5          1.1          84.0          15.0
                        12           4.3          1.19           5.6          1.0          93.0          6.3
                        13           4.9          1.28           5.2          5.6          72.0          22.5
                        14           7.8          1.57           4.0         11.2          78.6          10.3
                        15           6.0          1.28           4.3         10.1          75.8          14.0
                        16           7.8          1.55           4.0         11.3          75.8          13.0
            CCm         17           8.7          3.04           7.0          3.0          78.2          18.8
                        18           3.4          1.83          10.8          1.9          63.7          34.4
                        19           2.8          1.49          10.8          2.7          76.2          21.1
                        20           2.8          1.42          10.5          2.6          77.2          20.2
                        21           7.7          2.69           7.0          2.5          81.8          15.7
                        22           3.4          1.39           8.2          3.0          77.9          19.1
                        23           2.0          1.04          10.3          2.9          74.7          22.4
                        24           2.1          1.36          13.1          0.0          66.4          33.6
                        25           2.0          0.96           9.6          0.0          78.2          21.8
                        26           6.3          3.09           9.9          0.0          80.0          20.0
                        27          18.0          3.6            4.0         11.7          79.3          9.1
            PKm         28.0        10.0          1.6            6.3         14.8          82.9          2.4
                        29.0         5.4          1.1            8.4          9.3          87.0          3.7


                0.0012                                              0.0012
                       Micropores  Mesopores  Macropores
                                                                            Micropores  Mesopores   Macropores
                 0.001  PCM 8                                       0.001  CCM 17
               Incremental volume (cm 3 /g)  0.0008  9 12         Incremental volume (cm 3 /g)  0.0008  18

                                                                              19
                                                                              20
                0.0006
                                                                    0.0006
                           14
                                                                              21
                                                                              22
                           15
                0.0004
                                                                              24
                                                                              25
                0.0002                                              0.0004    23
                                                                    0.0002
                                                                              26
                                                                              27
                   0                                                    0
                    0.1      1        10      100     1000              0.1        1       10       100      1000
                                 Pore width (nm)                                       Pore width (nm)
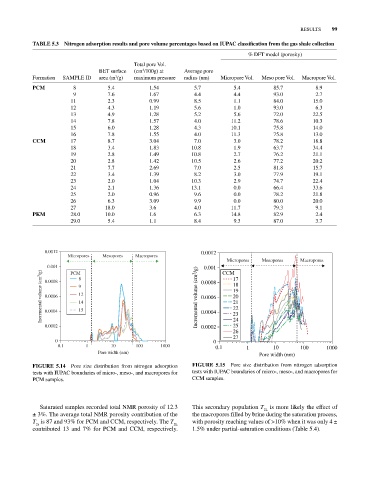
            FIGurE  5.14  Pore size distribution from nitrogen adsorption   FIGurE  5.15  Pore size distribution from nitrogen adsorption
            tests with IUPAC boundaries of micro‐, meso‐, and macropores for   tests with IUPAC boundaries of micro‐, meso‐, and macropores for
            PCM samples.                                         CCM samples.


              Saturated samples recorded total NMR porosity of 12.3   This secondary population T  is more likely the effect of
                                                                                        2L
            ± 3%. The average total NMR porosity contribution of the   the macropores filled by brine during the saturation process,
            T  is 87 and 93% for PCM and CCM, respectively. The T    with porosity reaching values of >10% when it was only 4 ±
             2s
                                                          2L
            contributed 13 and 7% for PCM and CCM, respectively.   1.5% under partial‐saturation conditions (Table 5.4).
   114   115   116   117   118   119   120   121   122   123   124