
Page 121 - Fundamentals of Gas Shale Reservoirs
P. 121
1 1
PCM CCM
8 10 9 0.8 17 18
0.8
Pore size distribution (%) 0.6 12 13 Pore size distribution (%) 0.6 23 24
11
20
21
25
14
15
26
0.4
27
0.4
0.2
0.2
0
0 0.01 0.1 1 10 100 1,000 10,000
0.01 0.1 1 10 100 1,000 10,000 relaxation time (ms)
T 2 relaxation time (ms) T 2
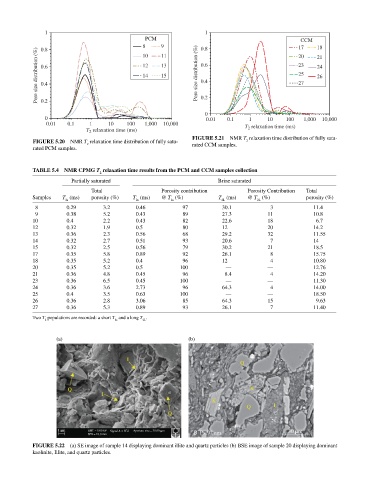
FIGurE 5.21 NMR T relaxation time distribution of fully satu
FIGurE 5.20 NMR T relaxation time distribution of fully satu 2
2
rated PCM samples. rated CCM samples.
TabLE 5.4 Nmr CPmG T relaxation time results from the PCm and CCm samples collection
2
Partially saturated Brine saturated
Total Porosity contribution Porosity Contribution Total
Samples T (ms) porosity (%) T (ms) @ T (%) T (ms) @ T (%) porosity (%)
2s 2s 2s 2L 2L
8 0.29 3.2 0.46 97 30.1 3 11.4
9 0.38 5.2 0.43 89 27.3 11 10.8
10 0.4 2.2 0.43 82 22.6 18 6.7
12 0.32 1.9 0.5 80 12 20 14.2
13 0.36 2.3 0.56 68 29.2 32 11.55
14 0.32 2.7 0.51 93 20.6 7 14
15 0.32 2.5 0.56 79 30.2 21 18.5
17 0.35 5.8 0.89 92 26.1 8 15.75
18 0.35 5.2 0.4 96 12 4 10.80
20 0.35 5.2 0.5 100 — — 12.76
21 0.36 4.8 0.45 96 8.4 4 14.20
23 0.36 6.5 0.45 100 — — 11.30
24 0.36 3.6 2.73 96 64.3 4 14.00
25 0.4 3.5 0.63 100 — — 18.50
26 0.36 2.8 3.06 85 64.3 15 9.63
27 0.36 5.3 0.89 93 26.1 7 11.40
Two T populations are recorded: a short T and a long T .
2
2s
2L
(a) (b)
I
Q
Q K
I
K
Q I
Q
1 m EHT = 5.00 kV Signal A = SE2 Aperture size = 30.00 m 30 m
WD = 10.0 mm B Px:97 nm
FIGurE 5.22 (a) SE image of sample 14 displaying dominant illite and quartz particles (b) BSE image of sample 20 displaying dominant
kaolinite, Illite, and quartz particles.