
Page 112 - Fundamentals of Gas Shale Reservoirs
P. 112
92 PORE GEOMETRY IN GAS SHALE RESERVOIRS
100,000 The total pore volume is derived from the amount of
vapor adsorbed at a relative pressure close to unity, by
10,000 assuming that the pores are then filled with liquid adsorbate.
Data points The average pore size could be estimated from the total pore
1,000 volume determined at maximum pressure, by assuming that
Threshold the pores which would not be filled below a relative pressure
P c (psi) pressure 100 of 1 have a negligible contribution to the total pore volume.
Irreducible For example, assuming cylindrical pore geometry, the
wetting phase 10 average pore radius (r ) can be expressed as:
p
saturation
1 2 V
r p ads (5.3)
0.1 S
100 90 80 70 60 50 40 30 20 10 0 where V is the total amount of nitrogen adsorbed and S is
ads
Shg (%) the surface area (Quantachrome Instruments, 2008).
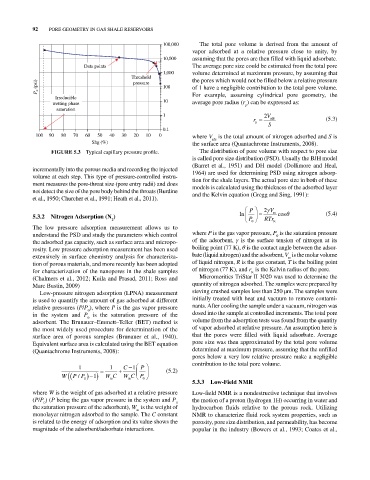
FIGurE 5.3 Typical capillary pressure profile. The distribution of pore volume with respect to pore size
is called pore size distribution (PSD). Usually the BJH model
(Barret et al., 1951) and DH model (Dollimore and Heal,
incrementally into the porous media and recording the injected 1964) are used for determining PSD using nitrogen adsorp
volume at each step. This type of pressure‐controlled instru tion for the shale layers. The actual pore size in both of these
ment measures the pore‐throat size (pore entry radii) and does models is calculated using the thickness of the adsorbed layer
not detect the size of the pore body behind the throats (Burdine and the Kelvin equation (Gregg and Sing, 1991):
et al., 1950; Churcher et al., 1991; Heath et al., 2011).
P 2 V m
5.3.2 Nitrogen adsorption (N ) ln cos (5.4)
2 P RTr
0 K
The low pressure adsorption measurement allows us to
understand the PSD and study the parameters which control where P is the gas vapor pressure, P is the saturation pressure
0
the adsorbed gas capacity, such as surface area and micropo of the adsorbent, γ is the surface tension of nitrogen at its
rosity. Low pressure adsorption measurement has been used boiling point (77 K), θ is the contact angle between the adsor
extensively in surface chemistry analysis for characteriza bate (liquid nitrogen) and the adsorbent, V is the molar volume
m
tion of porous materials, and more recently has been adopted of liquid nitrogen, R is the gas constant, T is the boiling point
for characterization of the nanopores in the shale samples of nitrogen (77 K), and r is the Kelvin radius of the pore.
K
(Chalmers et al., 2012; Kuila and Prasad, 2011; Ross and Micromeritics TriStar II 3020 was used to determine the
Marc Bustin, 2009) quantity of nitrogen adsorbed. The samples were prepared by
Low‐pressure nitrogen adsorption (LPNA) measurement sieving crushed samples less than 250 µm. The samples were
is used to quantify the amount of gas adsorbed at different initially treated with heat and vacuum to remove contami
relative pressures (P/P ), where P is the gas vapor pressure nants. After cooling the sample under a vacuum, nitrogen was
0
in the system and P is the saturation pressure of the dosed into the sample at controlled increments. The total pore
0
adsorbent. The Brunauer–Emmett–Teller (BET) method is volume from the adsorption tests was found from the quantity
the most widely used procedure for determination of the of vapor adsorbed at relative pressure. An assumption here is
surface area of porous samples (Brunauer et al., 1940). that the pores were filled with liquid adsorbate. Average
Equivalent surface area is calculated using the BET equation pore size was then approximated by the total pore volume
(Quantachrome Instruments, 2008): determined at maximum pressure, assuming that the unfilled
pores below a very low relative pressure make a negligible
contribution to the total pore volume.
1 1 C 1 P
(5.2)
/
W P P 0 1 WC WC P 0
m
m
5.3.3 Low‐Field Nmr
where W is the weight of gas adsorbed at a relative pressure Low‐field NMR is a nondestructive technique that involves
(P/P ) (P being the gas vapor pressure in the system and P the motion of a proton (hydrogen 1H) occurring in water and
0
0
the saturation pressure of the adsorbent), W is the weight of hydrocarbon fluids relative to the porous rock. Utilizing
m
monolayer nitrogen adsorbed to the sample. The C constant NMR to characterize fluid rock system properties, such as
is related to the energy of adsorption and its value shows the porosity, pore size distribution, and permeability, has become
magnitude of the adsorbent/adsorbate interactions. popular in the industry (Bowers et al., 1993; Coates et al.,