
Page 128 - Fundamentals of Gas Shale Reservoirs
P. 128
108 PORE GEOMETRY IN GAS SHALE RESERVOIRS
It is believed that transport properties of a tight rock are levels. Every rock may vary in R values depending on its
dictated by the pore structure (Bustin et al., 2008). Many pore structure and geometry. The authors stress that the com
researchers have attempted and developed mathematical parisons between the measured and predicted permeability
models to predict permeability based on pore size such as based on pore throat size made are indefinite, but they serve
MICP tests (Dastidar et al., 2007; Pittman, 1992; Rezaee as an indication of the method that would function better in
et al., 2006). The aim here was to provide an understanding evaluating the permeability of a gas shale formation (Al
of the interrelation between fluid flow and the physical prop Hinai et al., 2013).
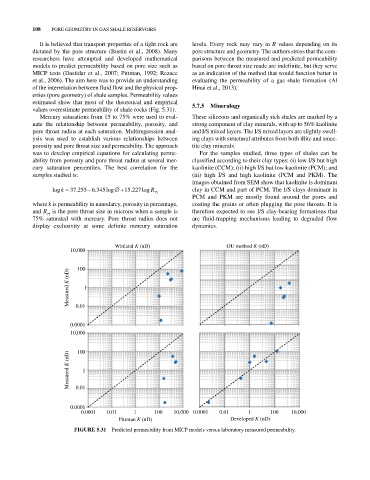
erties (pore geometry) of shale samples. Permeability values
estimated show that most of the theoretical and empirical 5.7.5 mineralogy
values overestimate permeability of shale rocks (Fig. 5.31).
Mercury saturations from 15 to 75% were used to eval These siliceous and organically rich shales are marked by a
uate the relationship between permeability, porosity, and strong component of clay minerals, with up to 56% kaolinite
pore throat radius at each saturation. Multiregression anal and I/S mixed layers. The I/S mixed layers are slightly swell
ysis was used to establish various relationships between ing clays with structural attributes from both illite and smec
porosity and pore throat size and permeability. The approach tite clay minerals.
was to develop empirical equations for calculating perme For the samples studied, three types of shales can be
ability from porosity and pore throat radius at several mer classified according to their clay types: (i) low I/S but high
cury saturation percentiles. The best correlation for the kaolinite (CCM); (ii) high I/S but low kaolinite (PCM); and
samples studied is: (iii) high I/S and high kaolinite (PCM and PKM). The
images obtained from SEM show that kaolinite is dominant
logk 37 .255 6 .345 log 15 .227 log R 75 clay in CCM and part of PCM. The I/S clays dominant in
PCM and PKM are mostly found around the pores and
where k is permeability in nanodarcy, porosity in percentage, coating the grains or often plugging the pore throats. It is
and R is the pore throat size in microns when a sample is therefore expected to see I/S clay‐bearing formations that
75
75% saturated with mercury. Pore throat radius does not are fluid‐trapping mechanisms leading to degraded flow
display exclusivity at some definite mercury saturation dynamics.
Winland K (nD) OU method K (nD)
10,000
100
Measured K (nD) 0.01 1
0.0001
10,000
100
Measured K (nD) 0.01 1
0.0001
0.0001 0.01 1 100 10,000 0.0001 0.01 1 100 10,000
Pittman K (nD) Developed K (nD)
FIGurE 5.31 Predicted permeability from MICP models versus laboratory measured permeability.