
Page 132 - Fundamentals of Gas Shale Reservoirs
P. 132
112 PORE GEOMETRY IN GAS SHALE RESERVOIRS
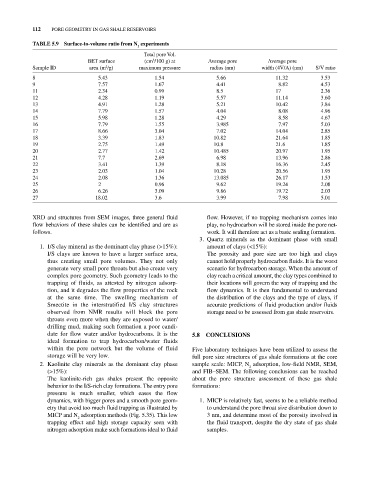
TabLE 5.9 Surface‐to‐volume ratio from N experiments
2
Total pore Vol.
3
BET surface (cm /100 g) at Average pore Average pore
2
Sample ID area (m /g) maximum pressure radius (nm) width (4V/A) (nm) S/V ratio
8 5.43 1.54 5.66 11.32 3.53
9 7.57 1.67 4.41 8.82 4.53
11 2.34 0.99 8.5 17 2.36
12 4.28 1.19 5.57 11.14 3.60
13 4.91 1.28 5.21 10.42 3.84
14 7.79 1.57 4.04 8.08 4.96
15 5.98 1.28 4.29 8.58 4.67
16 7.79 1.55 3.985 7.97 5.03
17 8.66 3.04 7.02 14.04 2.85
18 3.39 1.83 10.82 21.64 1.85
19 2.75 1.49 10.8 21.6 1.85
20 2.77 1.42 10.485 20.97 1.95
21 7.7 2.69 6.98 13.96 2.86
22 3.41 1.39 8.18 16.36 2.45
23 2.03 1.04 10.28 20.56 1.95
24 2.08 1.36 13.085 26.17 1.53
25 2 0.96 9.62 19.24 2.08
26 6.26 3.09 9.86 19.72 2.03
27 18.02 3.6 3.99 7.98 5.01
XRD and structures from SEM images, three general fluid flow. However, if no trapping mechanism comes into
flow behaviors of these shales can be identified and are as play, no hydrocarbon will be stored inside the pore net
follows. work. It will therefore act as a basic sealing formation.
3. Quartz minerals as the dominant phase with small
1. I/S clay mineral as the dominant clay phase (>15%): amount of clays (<15%):
I/S clays are known to have a larger surface area, The porosity and pore size are too high and clays
thus creating small pore volumes. They not only cannot hold properly hydrocarbon fluids. It is the worst
generate very small pore throats but also create very scenario for hydrocarbon storage. When the amount of
complex pore geometry. Such geometry leads to the clay reach a critical amount, the clay types combined to
trapping of fluids, as attested by nitrogen adsorp their locations will govern the way of trapping and the
tion, and it degrades the flow properties of the rock flow dynamics. It is then fundamental to understand
at the same time. The swelling mechanism of the distribution of the clays and the type of clays, if
Smectite in the interstratified I/S clay structures accurate predictions of fluid production and/or fluids
observed from NMR results will block the pore storage need to be assessed from gas shale reservoirs.
throats even more when they are exposed to water/
drilling mud, making such formation a poor candi
date for flow water and/or hydrocarbons. It is the 5.8 CONCLuSIONS
ideal formation to trap hydrocarbon/water fluids
within the pore network but the volume of fluid Five laboratory techniques have been utilized to assess the
storage will be very low. full pore size structures of gas shale formations at the core
2. Kaolinite clay minerals as the dominant clay phase sample scale: MICP, N adsorption, low‐field NMR, SEM,
2
(>15%): and FIB–SEM. The following conclusions can be reached
The kaolinite‐rich gas shales present the opposite about the pore structure assessment of these gas shale
behavior to the I/S‐rich clay formations. The entry pore formations:
pressure is much smaller, which eases the flow
dynamics, with bigger pores and a smooth pore geom 1. MICP is relatively fast, seems to be a reliable method
etry that avoid too much fluid trapping as illustrated by to understand the pore throat size distribution down to
MICP and N adsorption methods (Fig. 5.35). This low 3 nm, and determine most of the porosity involved in
2
trapping effect and high storage capacity seen with the fluid transport, despite the dry state of gas shale
nitrogen adsorption make such formations ideal to fluid samples.