Page 131 - Fundamentals of Gas Shale Reservoirs
P. 131

DISCUSSION   111
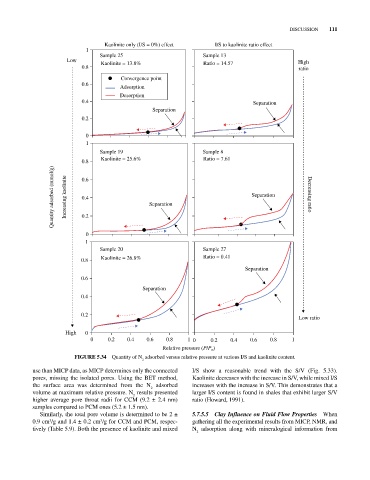
                                    Kaolinite only (I/S = 0%) effect    I/S to kaolinite ratio effect
                             1
                                  Sample 25                         Sample 13
                       Low        Kaolinite = 13.8%                 Ratio = 14.57                   High
                            0.8                                                                     ratio

                                         Convergence point
                            0.6          Adsorption
                                         Desorption
                            0.4                                                      Separation
                                                   Separation
                            0.2

                             0
                             1
                                  Sample 19                         Sample 8
                            0.8   Kaolinite = 25.6%                 Ratio = 7.61
                   Quantity adsorbed (mmol/g)  Increasing kaolinite  0.6  Separation  Separation       Decreasing ratio


                            0.4


                            0.2


                             0
                             1
                                  Sample 20                         Sample 27
                            0.8   Kaolinite = 26.8%                 Ratio = 0.41
                                                                                  Separation
                            0.6
                                                Separation
                            0.4


                            0.2
                                                                                                    Low ratio

                       High  0
                               0     0.2   0.4    0.6   0.8    1 0     0.2   0.4    0.6   0.8     1
                                                       Relative pressure (P/P )
                                                                       o
                          FIGurE 5.34  Quantity of N  adsorbed versus relative pressure at various I/S and kaolinite content.
                                                2
            use than MICP data, as MICP determines only the connected   I/S show a reasonable trend with the S/V (Fig.  5.33).
            pores, missing the isolated pores. Using the BET method,   Kaolinite decreases with the increase in S/V, while mixed I/S
            the surface area was determined from the N  adsorbed   increases with the increase in S/V. This demonstrates that a
                                                   2
            volume at maximum relative pressure. N  results presented   larger I/S content is found in shales that exhibit larger S/V
                                             2
            higher average pore throat radii for CCM (9.2 ± 2.4 nm)   ratio (Howard, 1991).
            samples compared to PCM ones (5.2 ± 1.5 nm).
              Similarly, the total pore volume is determined to be 2 ±   5.7.5.5  Clay Influence on Fluid Flow Properties  When
            0.9 cm /g and 1.4 ± 0.2 cm /g for CCM and PCM, respec­  gathering all the experimental results from MICP, NMR, and
                                  3
                 3
            tively (Table 5.9). Both the presence of kaolinite and mixed   N  adsorption along with mineralogical information from
                                                                  2
   126   127   128   129   130   131   132   133   134   135   136