Page 165 - Fundamentals of Gas Shale Reservoirs
P. 165

OVERPRESSuRE-GEnERATInG mEchAnISmS    145
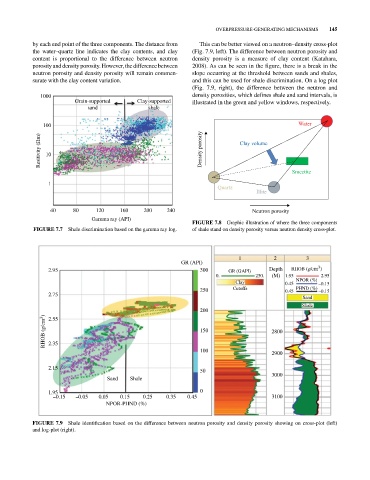
            by each end point of the three components. The distance from   This can be better viewed on a neutron–density cross‐plot
            the water–quartz line indicates the clay contents, and clay   (Fig. 7.9, left). The difference between neutron porosity and
            content is proportional to the difference between neutron   density porosity is a measure of clay content (Katahara,
            porosity and density porosity. however, the difference  between   2008). As can be seen in the figure, there is a break in the
            neutron porosity and density porosity will remain commen-  slope occurring at the threshold between sands and shales,
            surate with the clay content variation.              and this can be used for shale discrimination. On a log plot
                                                                 (Fig.  7.9, right), the difference between the neutron and
              1000                                               density porosities, which defines shale and sand intervals, is
                          Grain-supported     Clay-supported     illustrated in the green and yellow windows, respectively.
                              sand                shale

               100                                                                                  Water

              Resitivity ( m)  10                                   Density porosity  Clay volume


                                                                                                  Smectite
                 1
                                                                         Quartz
                                                                                      Illite


                  40     80      120     160     200    240                         Neutron porosity
                               Gamma ray (API)
                                                                 FIGURE 7.8  Graphic illustration of where the three components
            FIGURE 7.7  Shale discrimination based on the gamma ray log.  of shale stand on density porosity versus neutron density cross‐plot.


                                                                                1           2         3
                                                             GR (API)
                                                                                                          3
                 2.95                                              300       GR (GAPI)    Depth  RHOB (g/cm )
                                                                        0.            250.  (M)  1.95      2.95
                                                                               Clay            0.45  NPOR (%)  –0.15
                                                                   250        Cutoffs          0.45  PHND (%)  –0.15
                 2.75
                                                                                                     Sand
                                                                                                     Shale
                                                                   200
                RHOB (g/cm 3 )                                     150                     2800
                 2.55


                 2.35
                                                                   100
                                                                                           2900
                 2.15
                                                                   50
                                    Sand    Shale                                          3000

                 1.95                                              0
                   –0.15  –0.05   0.05   0.15   0.25    0.35   0.45                        3100
                                    NPOR-PHND (%)


            FIGURE 7.9  Shale identification based on the difference between neutron porosity and density porosity showing on cross‐plot (left)
            and log‐plot (right).
   160   161   162   163   164   165   166   167   168   169   170