
Page 167 - Fundamentals of Gas Shale Reservoirs
P. 167
OVERPRESSuRE ESTImATIOn mEThOdS 147
ob infer porosity and hence, detect any abnormality of pore
pressure within the shales (Athy, 1930; Rubey and hubbert,
1959). The ncTs obtained from Equations 7.5 and 7.6 are
fitted on wireline log(s) data such as sonic transit time,
electrical resistivity, and density. Among well log data, sonic
transit time is the most commonly used as a porosity‐
dependent parameter. This is because it is usually available
with good quality and less affected by the bad borehole
conditions compared to other well log data.
For proper estimation of pore pressure in shales, it is
important to establish a reliable ncT. According to Ramdhan
and Goulty (2011), the three main techniques for defining
v ncTs from wireline logs are (1) direct plots of wireline log
P p data versus depth, (2) plot of wireline log data versus effec-
tive stress, and (3) cross‐plotting wireline log data.
P p = ob – v
7.3.2 Eaton’s Method
The principle of Eaton’s method is the comparison of the
wireline log data and drilling data with the ncTs at the
same depths. Eaton (1975) developed four equations for
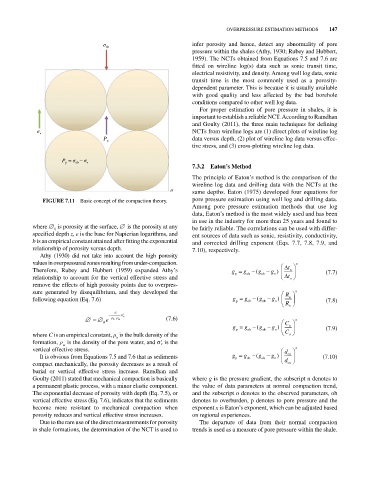
FIGURE 7.11 Basic concept of the compaction theory. pore pressure estimation using well log and drilling data.
Among pore pressure estimation methods that use log
data, Eaton’s method is the most widely used and has been
in use in the industry for more than 25 years and found to
where 0 is porosity at the surface, is the porosity at any be fairly reliable. The correlations can be used with differ-
specified depth z, e is the base for napierian logarithms, and ent sources of data such as sonic, resistivity, conductivity,
b is an empirical constant attained after fitting the exponential and corrected drilling exponent (Eqs. 7.7, 7.8, 7.9, and
relationship of porosity versus depth. 7.10), respectively.
Athy (1930) did not take into account the high porosity
values in overpressured zones resulting from under‐ compaction. x
Therefore, Rubey and hubbert (1959) expanded Athy’s g g g ( g ) t n (7.7)
relationship to account for the vertical effective stress and p ob ob n t o
remove the effects of high porosity points due to overpres-
sure generated by disequilibrium, and they developed the R x
following equation (Eq. 7.6) g p g ob g ( ob g ) o (7.8)
n
R n
C
e b w v (7.6) x
0 C
g p g ob g ( ob g ) n (7.9)
n
where C is an empirical constant, ρ is the bulk density of the C o
b
formation, ρ is the density of the pore water, and σ′ v is the
w
vertical effective stress. d x
It is obvious from Equations 7.5 and 7.6 that as sediments g p g ob g ( ob g ) co (7.10)
n
compact mechanically, the porosity decreases as a result of d cn
burial or vertical effective stress increase. Ramdhan and
Goulty (2011) stated that mechanical compaction is basically where g is the pressure gradient, the subscript n denotes to
a permanent plastic process, with a minor elastic component. the value of data parameters at normal compaction trend,
The exponential decrease of porosity with depth (Eq. 7.5), or and the subscript o denotes to the observed parameters, ob
vertical effective stress (Eq. 7.6), indicates that the sediments denotes to overburden, p denotes to pore pressure and the
become more resistant to mechanical compaction when exponent x is Eaton’s exponent, which can be adjusted based
porosity reduces and vertical effective stress increases. on regional experiences.
due to the rare use of the direct measurements for porosity The departure of data from their normal compaction
in shale formations, the determination of the ncT is used to trends is used as a measure of pore pressure within the shale.