
Page 170 - Fundamentals of Gas Shale Reservoirs
P. 170
150 PORE PRESSuRE PREdIcTIOn FOR ShAlE FORmATIOnS uSInG WEll lOG dATA
• Then, pore pressure at point A is computed by The following relationships between vertical effective
subtracting the effective stress value at point B stress and velocity were developed by Bowers:
from the overburden stress at point A. Rearranging
Equation 7.13, 1. Virgin curve: the author developed the virgin curve
velocity–effective stress relationship for shale
(Eq. 7.15) based on the in situ data for effective stress,
P P ( ) (7.14)
p(A) n(B) ob(A) ob(B)
v 5000 A B (7.15)
7.3.4 bowers’s Method
Bowers (1995) modified the equivalent depth method to where A and B are virgin curve parameters obtained from
estimate pore pressure where overpressure is generated by fitting the velocity–effective stress relationship and cali-
either loading or unloading mechanisms. This author devel- brated with offset velocity–effective‐stress data, σ being
oped a useful tool to predict overpressure where the velocity the effective stress in psi and v the sonic velocity in ft/s.
versus effective stress relation is the key element used for 2. unloading curve: The author also proposed the empirical
overpressure estimation. Bowers explained also how the velocity–effective stress relationship (Eq. 7.16) for the
velocity–effective stress relationships can be used to identify unloading curve:
the overpressure‐generating mechanism in the area of study
while all the other methods do not take into account the 1 B U
cause of overpressures. v max 1 v 5000 (7.16)
under normal compaction with normally pressured max A
sediments, sonic velocity and effective stress continue to 1
increase. The velocity–effective stress relationship will be With v 5000 B
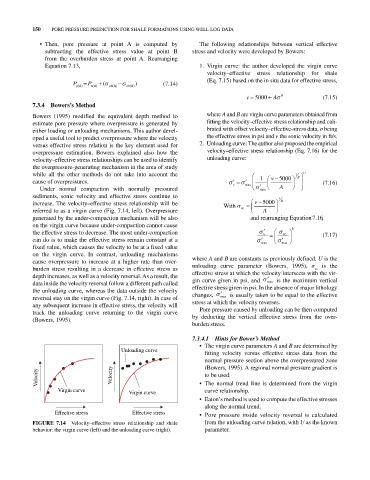
referred to as a virgin curve (Fig. 7.14, left). Overpressure vc A
generated by the under‐compaction mechanism will be also andrearranging Equation716. ,
on the virgin curve because under‐compaction cannot cause U
the effective stress to decrease. The most under‐compaction v vc (7.17)
can do is to make the effective stress remain constant at a max max
fixed value, which causes the velocity to be at a fixed value
on the virgin curve. In contrast, unloading mechanisms
cause overpressure to increase at a higher rate than over- where A and B are constants as previously defined, U is the
burden stress resulting in a decrease in effective stress as unloading curve parameter (Bowers, 1995), σ is the
vc
depth increases, as well as a velocity reversal. As a result, the effective stress at which the velocity intersects with the vir-
data inside the velocity reversal follow a different path called gin curve given in psi, and max is the maximum vertical
the unloading curve, whereas the data outside the velocity effective stress given in psi. In the absence of major lithology
reversal stay on the virgin curve (Fig. 7.14, right). In case of changes, max is usually taken to be equal to the effective
any subsequent increase in effective stress, the velocity will stress at which the velocity reverses.
track the unloading curve returning to the virgin curve Pore pressure caused by unloading can be then computed
(Bowers, 1995). by deducting the vertical effective stress from the over-
burden stress.
7.3.4.1 Hints for Bower’s Method
• The virgin curve parameters A and B are determined by
Unloading curve
fitting velocity versus effective stress data from the
normal pressure section above the overpressured zone
(Bowers, 1995). A regional normal pressure gradient is
Velocity Velocity • The normal trend line is determined from the virgin
to be used.
Virgin curve Virgin curve curve relationship.
• Eaton’s method is used to compute the effective stresses
along the normal trend.
Effective stress Effective stress • Pore pressure inside velocity reversal is calculated
FIGURE 7.14 Velocity–effective stress relationship and shale from the unloading curve relation, with U as the known
behavior: the virgin curve (left) and the unloading curve (right). parameter.