
Page 174 - Fundamentals of Gas Shale Reservoirs
P. 174
154 PORE PRESSuRE PREdIcTIOn FOR ShAlE FORmATIOnS uSInG WEll lOG dATA
–29
–29.2
–1800
–900 –2300 –29.4 –1700
–800
–1800
–700
–600 –200
–500 –1500 –1800 –2300
–400
–300 –500
–29.6
–800
–200
–1100
–29.8 –900
–800 –1500 –1400
–600
–3 –700 –1700
–1000 –30 –500 –300 –2000
–400
–2000 –200 –2300
–3000 114.8 –2600
115 –30.2 –2900
115.2 114.8 115 115.2 –3200
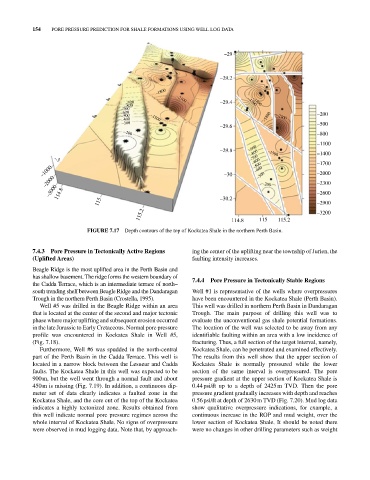
FIGURE 7.17 depth contours of the top of Kockatea Shale in the northern Perth Basin.
7.4.3 Pore Pressure in Tectonically Active Regions ing the center of the uplifting near the township of Jurien, the
(Uplifted Areas) faulting intensity increases.
Beagle Ridge is the most uplifted area in the Perth Basin and
has shallow basement. The ridge forms the western boundary of 7.4.4 Pore Pressure in Tectonically Stable Regions
the cadda Terrace, which is an intermediate terrace of north–
south trending shelf between Beagle Ridge and the dandaragan Well #1 is representative of the wells where overpressures
Trough in the northern Perth Basin (crostella, 1995). have been encountered in the Kockatea Shale (Perth Basin).
Well #5 was drilled in the Beagle Ridge within an area This well was drilled in northern Perth Basin in dandaragan
that is located at the center of the second and major tectonic Trough. The main purpose of drilling this well was to
phase where major uplifting and subsequent erosion occurred evaluate the unconventional gas shale potential formations.
in the late Jurassic to Early cretaceous. normal pore pressure The location of the well was selected to be away from any
profile was encountered in Kockatea Shale in Well #5, identifiable faulting within an area with a low incidence of
(Fig. 7.18). fracturing. Thus, a full section of the target interval, namely,
Furthermore, Well #6 was spudded in the north‐central Kockatea Shale, can be penetrated and examined effectively.
part of the Perth Basin in the cadda Terrace. This well is The results from this well show that the upper section of
located in a narrow block between the lesueur and cadda Kockatea Shale is normally pressured while the lower
faults. The Kockatea Shale in this well was expected to be section of the same interval is overpressured. The pore
900 m, but the well went through a normal fault and about pressure gradient at the upper section of Kockatea Shale is
450 m is missing (Fig. 7.19). In addition, a continuous dip- 0.44 psi/ft up to a depth of 2425 m TVd. Then the pore
meter set of data clearly indicates a faulted zone in the pressure gradient gradually increases with depth and reaches
Kockatea Shale, and the core cut of the top of the Kockatea 0.56 psi/ft at depth of 2630 m TVd (Fig. 7.20). mud log data
indicates a highly tectonized zone. Results obtained from show qualitative overpressure indications, for example, a
this well indicate normal pore pressure regimes across the continuous increase in the ROP and mud weight, over the
whole interval of Kockatea Shale. no signs of overpressure lower section of Kockatea Shale. It should be noted there
were observed in mud logging data. note that, by approach- were no changes in other drilling parameters such as weight