
Page 179 - Fundamentals of Gas Shale Reservoirs
P. 179
ThE ROlE OF TEcTOnIc AcTIVITIES On PORE PRESSuRE In ShAlES 159
Well#3 Well#3
ROP vs RPM ROP vs RPM
Interval : 1000 : 2102 MD (meter) Interval : 1000 : 2102 PPG_Son (psi/ft)
300 2080 0.7 300 0.7
250 C 250
200 1720 0.6 200 0.6
RPM (rpm) 150 B PPM (rpm) 150
100 1360 0.5 100 0.5
50 A 50
0 1000 0.4 0 0.4
0 20 40 60 80 100 10 20 30 40 50 60 70 80 90
ROP (m/h) ROP (m/h)
Depths Depths
1000 M – 2102 m 1000 M – 2102 m
Well#3
ROP vs RPM
Interval : 1000 : 2102 Flow pump (gpm)
300
250
200 600
PPM (rpm) 150
100 500
50
0 400
10 20 30 40 50 60 70 80 90
ROP (m/h)
Depths
1000 M – 2102 m
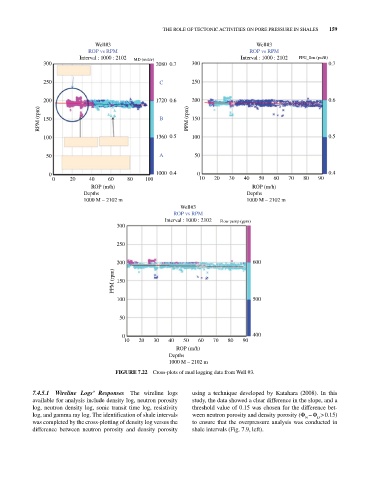
FIGURE 7.22 cross‐plots of mud logging data from Well #3.
7.4.5.1 Wireline Logs’ Responses The wireline logs using a technique developed by Katahara (2008). In this
available for analysis include density log, neutron porosity study, the data showed a clear difference in the slope, and a
log, neutron density log, sonic transit time log, resistivity threshold value of 0.15 was chosen for the difference bet-
log, and gamma ray log. The identification of shale intervals ween neutron porosity and density porosity (Φ − Φ > 0.15)
n
d
was completed by the cross‐plotting of density log versus the to ensure that the overpressure analysis was conducted in
difference between neutron porosity and density porosity shale intervals (Fig. 7.9, left).