
Page 180 - Fundamentals of Gas Shale Reservoirs
P. 180
160 PORE PRESSuRE PREdIcTIOn FOR ShAlE FORmATIOnS uSInG WEll lOG dATA
13 porosity and density porosity fall farther from the smectite‐
Northampton high 12 25 neutron porosity–density porosity difference increases, and
–29 rich trend. It has been noticed that as depth increases, the
24
the ratio of smectite to illite decreases (illite percentage
11
26
8 increases), and there are increases in the pore pressure gradi-
0.5
0.49
–29.2 23 4 0.45 0.47 0.48 16 30 0.51 0.52 0.53 ents (unloading increase).
0.46 0.54 27 Further investigations were needed to ensure whether the
15 0.6
1718 22 patterns in Figure 7.25 are due to load transfer through clay
20 19 0.59
0.56 0.58 transformation (unloading) rather than just variations in clay
0.55 0.58 compositions. In order to do this, clay compositions were
–29.4 0.57 examined through XRd study.
14 0.54 1 0.57
0.53 Dandaragan trough
0.52
0.51 0.5 0.56 7.4.5.3 X-Ray Diffraction The proportions of different
0.47 0.49 0.55 minerals in the Kockatea Shale were further determined by
0.48
–29.6 2 0.54 examining XRd on rock samples taken from the wells. The
0.53 results presented in Tables 7.2 and 7.3 show that as depth
0.58
0.57 0.52 increases, the proportion of illite and mixed‐layer (illite‐
0.56 smectite) clays increases in the samples with minor or no
0.55 0.51
28 0.54 presence of smectite clay. These results can be interpreted by
–29.8 0.53 0.5
0.52
0.51 the consistent transformation of smectite clay to illite and
0.5
29 0.49
9 0.48 0.47 0.49 mixed‐layer (illite–smectite) clays. Remarkably, as depth
0.45 0.48 increases, the clay compositions are consistent with the pro-
7
0.47 cess of clay transformations from smectite to either illite or
–30 0.46 to mixed‐layer clay (illite–smectite), other than a random
5 0.46
variation of clay composition within the formations under
0.45 examination. In addition, the temperatures and the burial
Beagle ridge
4
0.44 depths for the Kockatea Shale in these two wells are in the
0.45
–30.2 0.43 0.44 0.43 range at which the processes of the clay transformations
0.42 mentioned occur.
6 0.41
7.4.5.4 Natural Gamma Ray Spectrometry Logs clay
114.8 115 115.2 minerals identification was further investigated by analyzing
the natural gamma ray spectrometry nGS logs. Analysis of
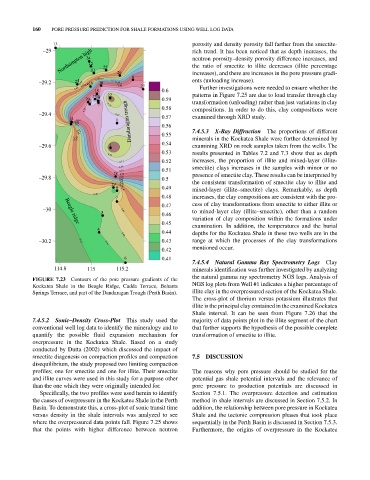
FIGURE 7.23 contours of the pore pressure gradients of the
Kockatea Shale in the Beagle Ridge, cadda Terrace, Beharra nGS log plots from Well #1 indicates a higher percentage of
Springs Terrace, and part of the dandaragan Trough (Perth Basin). illite clay in the overpressured section of the Kockatea Shale.
The cross‐plot of thorium versus potassium illustrates that
illite is the principal clay contained in the examined Kockatea
Shale interval. It can be seen from Figure 7.26 that the
7.4.5.2 Sonic–Density Cross-Plot This study used the majority of data points plot in the illite segment of the chart
conventional well log data to identify the mineralogy and to that further supports the hypothesis of the possible complete
quantify the possible fluid expansion mechanism for transformation of smectite to illite.
overpressure in the Kockatea Shale. Based on a study
conducted by dutta (2002) which discussed the impact of
smectite diagenesis on compaction profiles and compaction 7.5 DISCUSSION
disequilibrium, the study proposed two limiting compaction
profiles; one for smectite and one for illite. Their smectite The reasons why pore pressure should be studied for the
and illite curves were used in this study for a purpose other potential gas shale potential intervals and the relevance of
than the one which they were originally intended for. pore pressure to production potentials are discussed in
Specifically, the two profiles were used herein to identify Section 7.5.1. The overpressure detection and estimation
the causes of overpressure in the Kockatea Shale in the Perth method in shale intervals are discussed in Section 7.5.2. In
Basin. To demonstrate this, a cross‐plot of sonic transit time addition, the relationship between pore pressure in Kockatea
versus density in the shale intervals was analyzed to see Shale and the tectonic compression phases that took place
where the overpressured data points fall. Figure 7.25 shows sequentially in the Perth Basin is discussed in Section 7.5.3.
that the points with higher difference between neutron Furthermore, the origins of overpressure in the Kockatea