
Page 183 - Fundamentals of Gas Shale Reservoirs
P. 183
dIScuSSIOn 163
Well#1 Well#1
K/TH K/PE
Interval : 2290 : 2670 TVD Interval : 2290 : 2670 TVD
25 Possible 100% Kaolinite 2670 10 2670
Heavy thorium- bearing minerals Th/K:25 Th/K:12 Montmorillonite, Illite”
100% Illite point
20 Kaolinite “clay line” 2560 8 2594
Th/K:3.5 Chlorite Glauconite
15 6 Biotite 2518
TH ppm 10 Mixed layer clay 70% Illite Th/K:2 2470 PE 4 2442
Montmorillonite Illite 40% mica 2370 Illite Muscovite
Montmorillonite
5 Mica 30% glauconite 2 Kaolinite 2366
Th/K:0.6
Chlorite Glauconite Feldspar Th/K:0.3
0 Potassium evap 30% feldspar 2290 0 2290
0 1 2 3 4 5 0 2 4 6 8 10
K Potassium (%) K
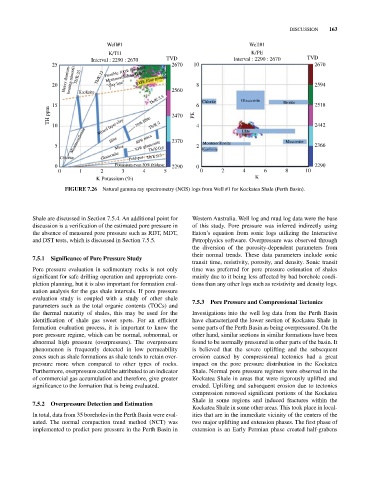
FIGURE 7.26 natural gamma ray spectrometry (nGS) logs from Well #1 for Kockatea Shale (Perth Basin).
Shale are discussed in Section 7.5.4. An additional point for Western Australia. Well log and mud log data were the base
discussion is a verification of the estimated pore pressure in of this study. Pore pressure was inferred indirectly using
the absence of measured pore pressure such as RdT, mdT, Eaton’s equation from sonic logs utilizing the Interactive
and dST tests, which is discussed in Section 7.5.5. Petrophysics software. Overpressure was observed through
the diversion of the porosity‐dependent parameters from
their normal trends. These data parameters include sonic
7.5.1 Significance of Pore Pressure Study
transit time, resistivity, porosity, and density. Sonic transit
Pore pressure evaluation in sedimentary rocks is not only time was preferred for pore pressure estimation of shales
significant for safe drilling operation and appropriate com- mainly due to it being less affected by bad borehole condi-
pletion planning, but it is also important for formation eval- tions than any other logs such as resistivity and density logs.
uation analysis for the gas shale intervals. If pore pressure
evaluation study is coupled with a study of other shale 7.5.3 Pore Pressure and Compressional Tectonics
parameters such as the total organic contents (TOcs) and
the thermal maturity of shales, this may be used for the Investigations into the well log data from the Perth Basin
identification of shale gas sweet spots. For an efficient have characterized the lower section of Kockatea Shale in
formation evaluation process, it is important to know the some parts of the Perth Basin as being overpressured. On the
pore pressure regime, which can be normal, subnormal, or other hand, similar sections in similar formations have been
abnormal high pressure (overpressure). The overpressure found to be normally pressured in other parts of the basin. It
phenomenon is frequently detected in low permeability is believed that the severe uplifting and the subsequent
zones such as shale formations as shale tends to retain over- erosion caused by compressional tectonics had a great
pressure more when compared to other types of rocks. impact on the pore pressure distribution in the Kockatea
Furthermore, overpressure could be attributed to an indicator Shale. normal pore pressure regimes were observed in the
of commercial gas accumulation and therefore, give greater Kockatea Shale in areas that were rigorously uplifted and
significance to the formation that is being evaluated. eroded. uplifting and subsequent erosion due to tectonics
compression removed significant portions of the Kockatea
Shale in some regions and induced fractures within the
7.5.2 Overpressure Detection and Estimation
Kockatea Shale in some other areas. This took place in local-
In total, data from 35 boreholes in the Perth Basin were eval- ities that are in the immediate vicinity of the centers of the
uated. The normal compaction trend method (ncT) was two major uplifting and extension phases. The first phase of
implemented to predict pore pressure in the Perth Basin in extension is an Early Permian phase created half‐grabens